Proportion test
Tests whether cell-type proportions differ across groups. CLR-transforms (centered log-ratio) per-sample proportions, then applies a limma-style empirical-Bayes moderated t-test for every pair of groups, with Benjamini–Hochberg FDR applied globally across all (pair × cell-type) hypotheses. Groups can be supplied either via a .obs column (group_col) or via a {sample_id: cluster} mapping (sample_to_clade) from cluster.
Call
from sampledisco.sample_clustering.proportion_test import proportion_test

proportion_test(
    adata=adata_cell,
    sample_col="sample",
    sample_to_clade=expr_clusters,     # from cluster(...)
    celltype_col="cell_type",
    output_dir="sampledisco_demo_output/rna/sample_cluster/expression",
)
Output
Writes → the directory given by output_dir:
proportion_test_<g1>_vs_<g2>.csv— one file per group pair: per cell-typelogFC,p_value,FDR.proportion_test_significant_summary.txt— text summary of cell types withFDR < 0.01, per comparison.proportion_heatmap_group_by_celltype.png— group-averaged cell-type proportion heatmap (plus CLR-scale and z-score variants).proportion_significance_matrix.png— cell-type × comparison significance grid.proportion_boxplot_<g1>_vs_<g2>.png— proportion boxplots for the top significant cell types of each comparison.
Result
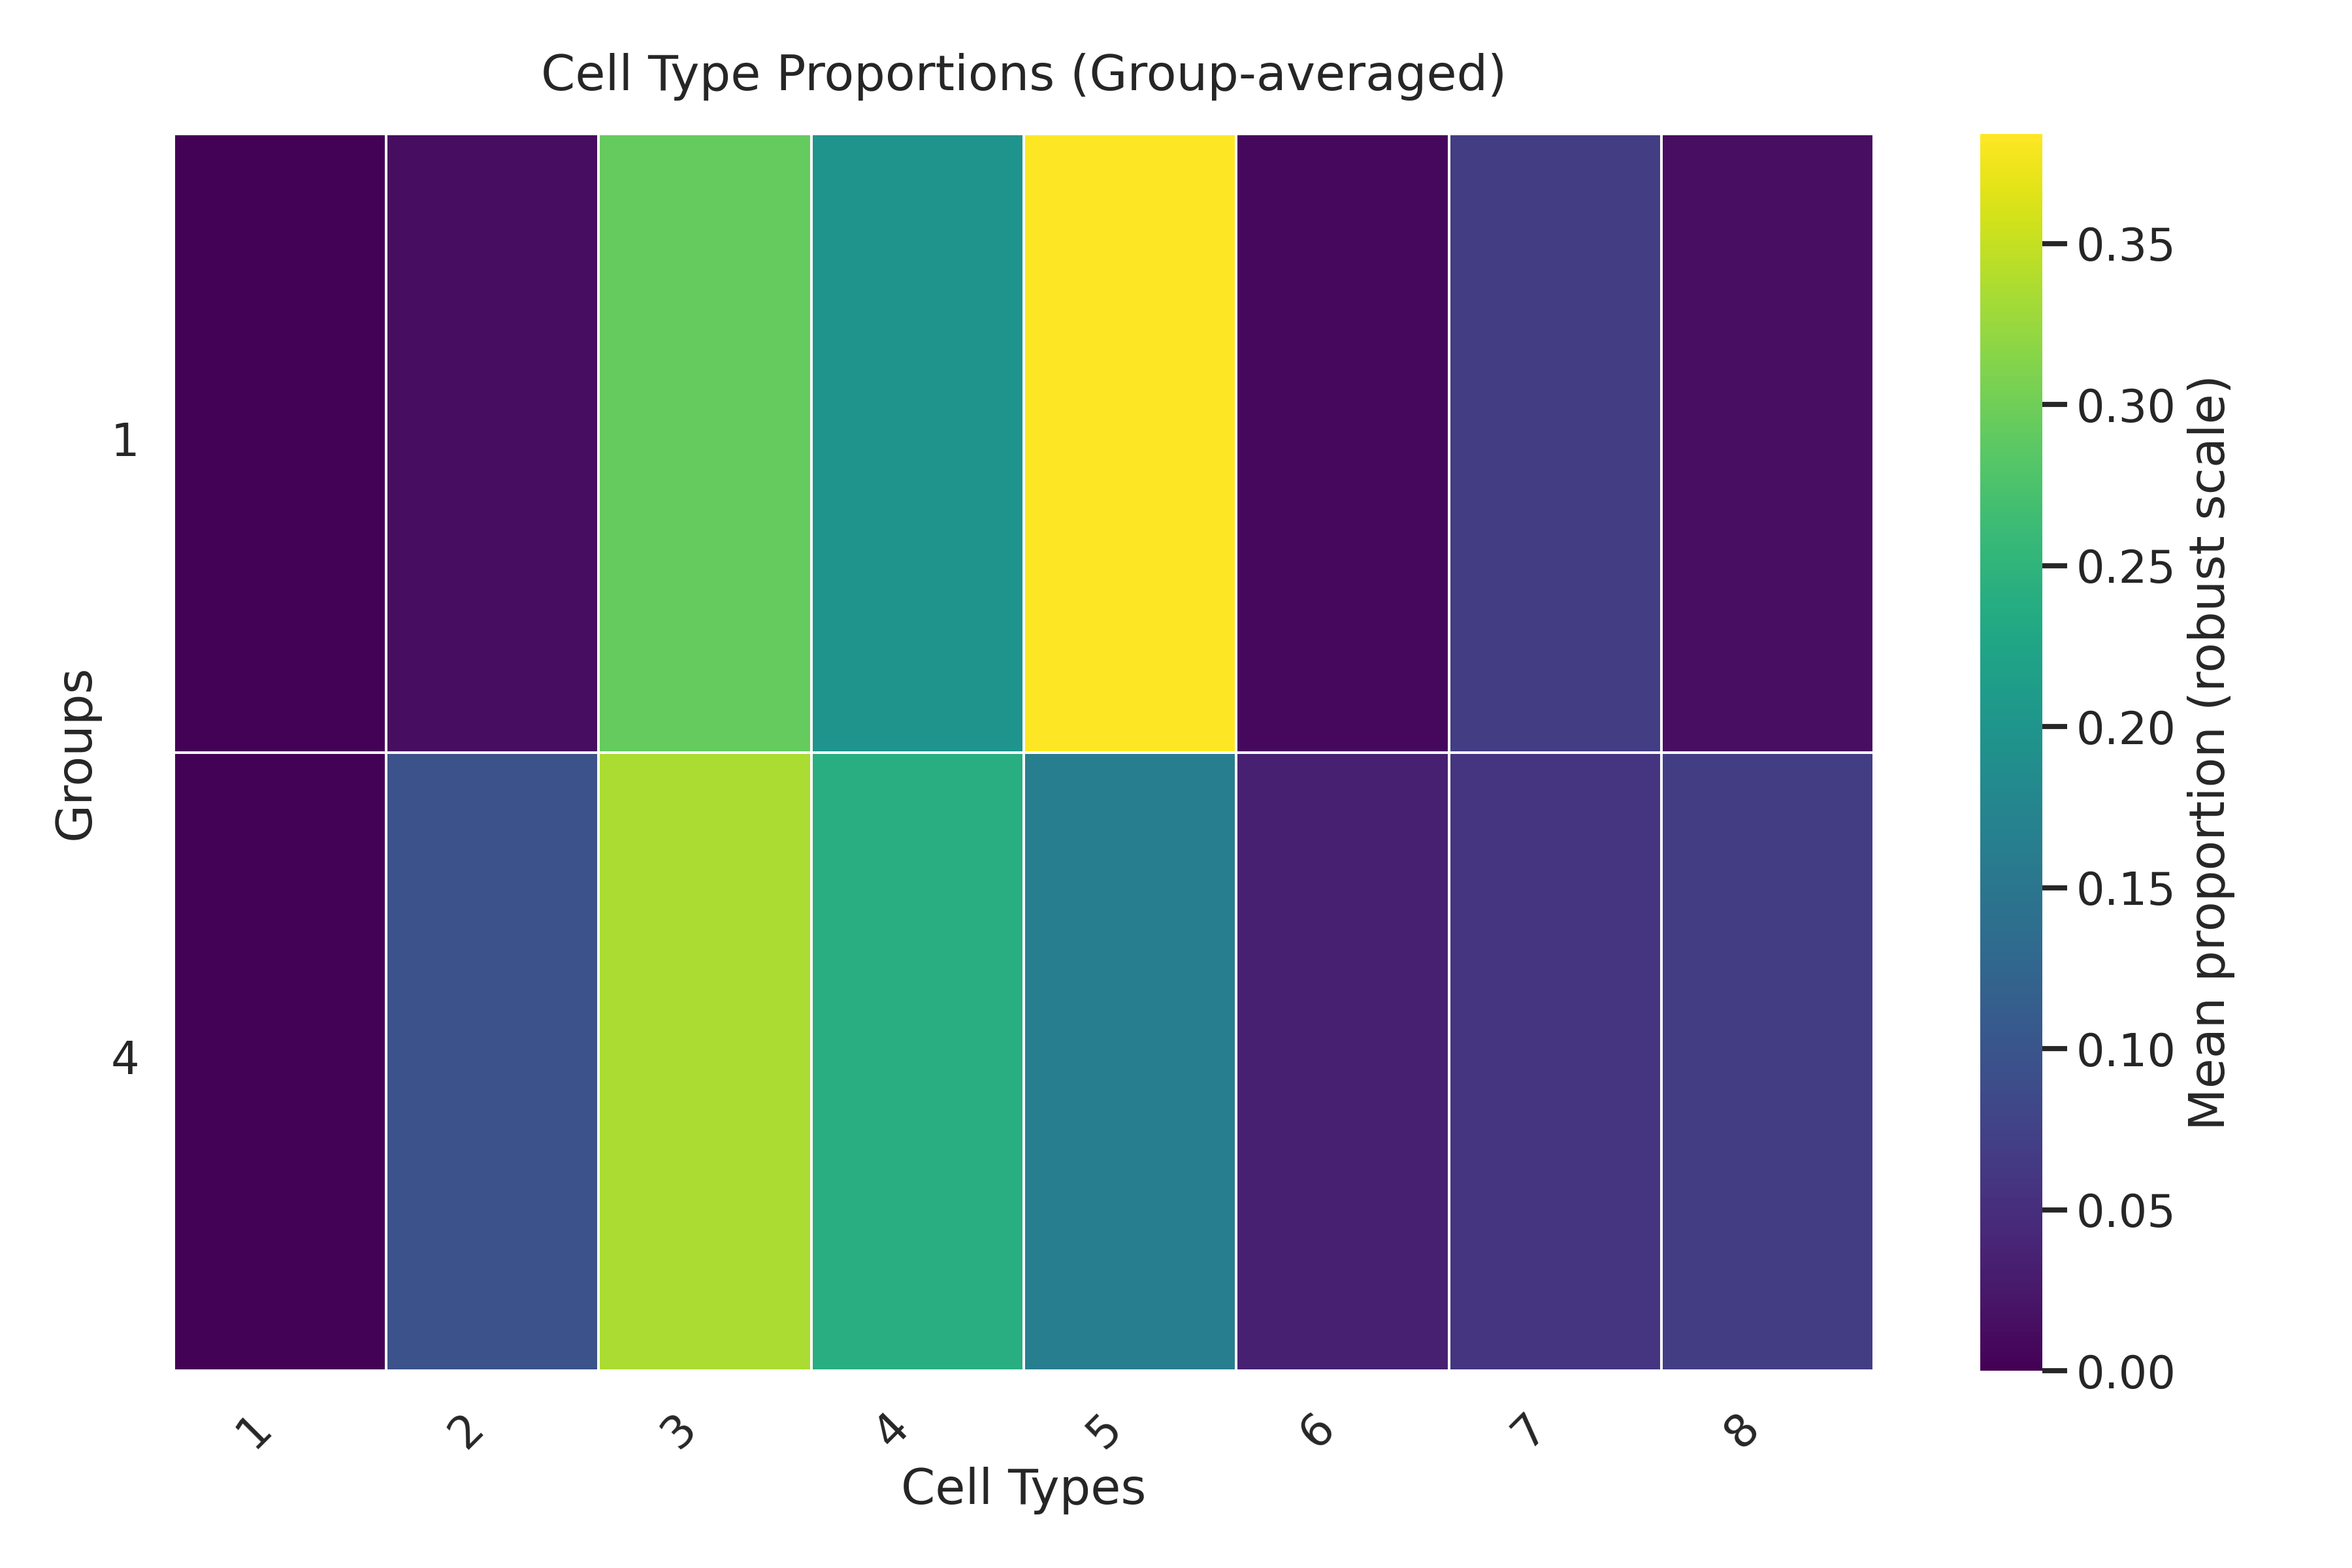
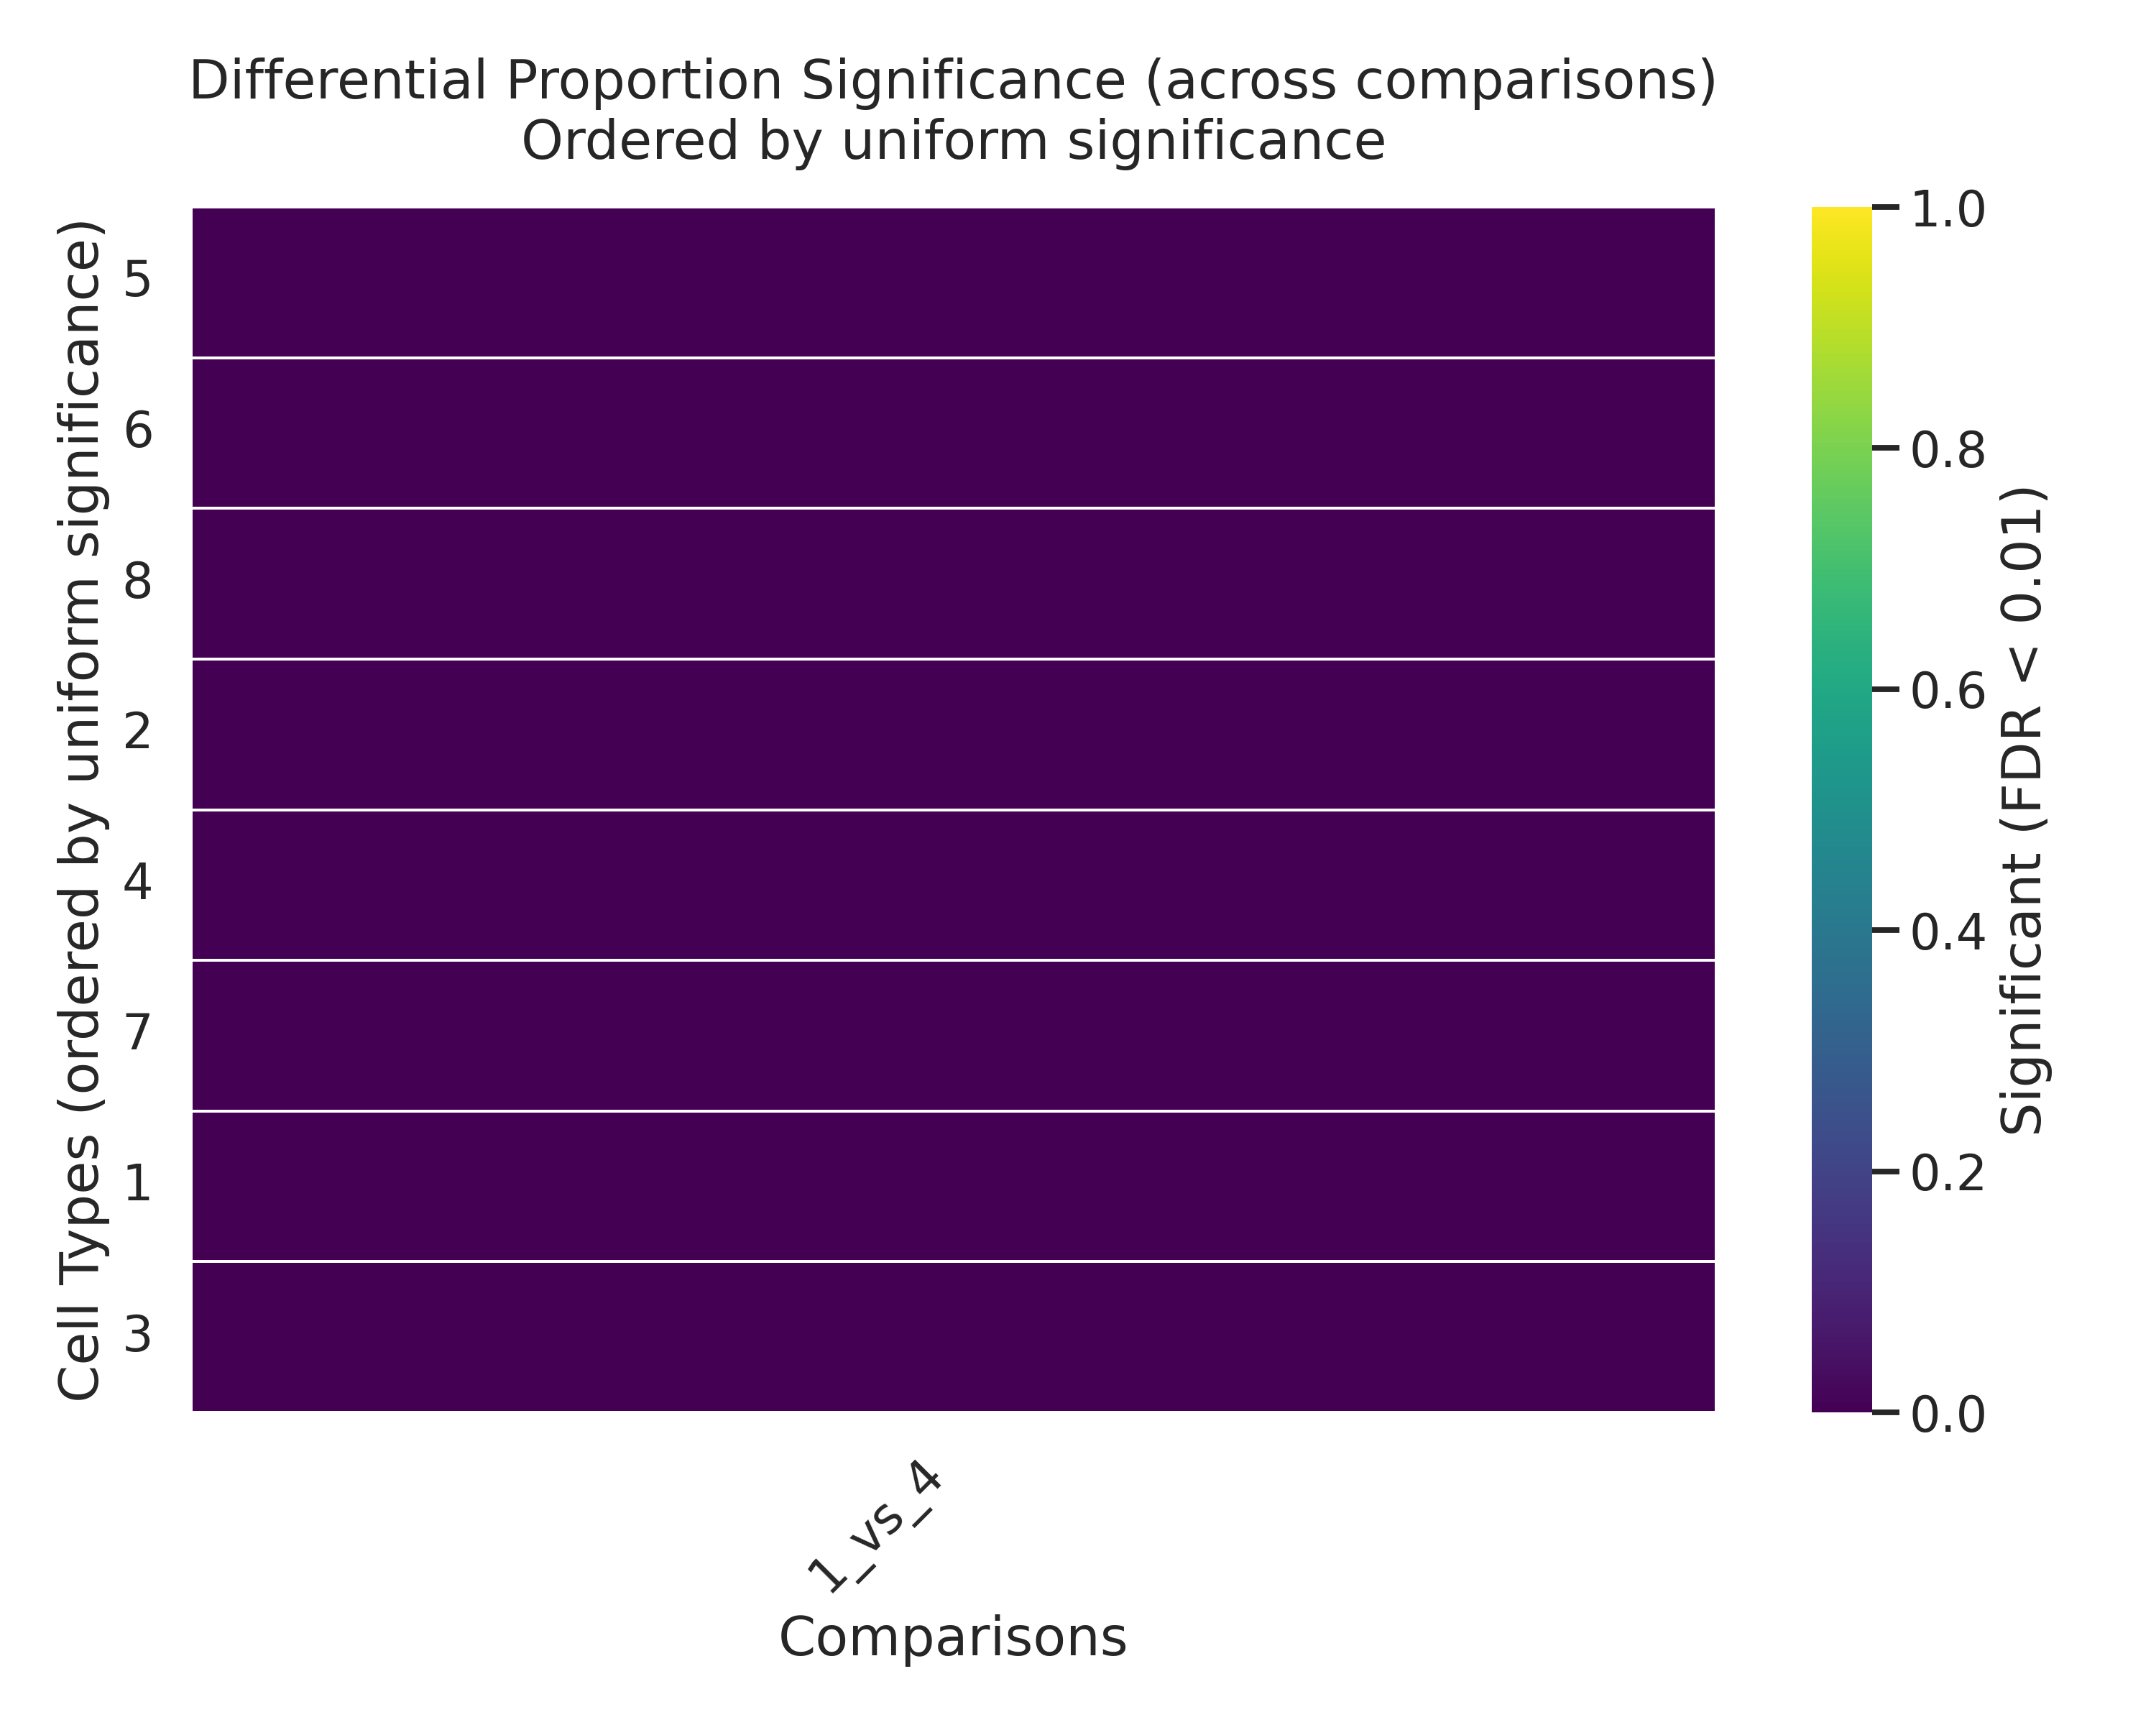
Per-sample cell-type proportions (left) and which cluster × cell-type combinations are significantly enriched or depleted (right).
See the API page for the full parameter list.