Trajectory DGE
Given a pseudotime (from CCA or TSCAN), this step fits a Generalized Additive Model per gene and ranks by effect size + FDR. It emits Lamian-style visualizations: a one-page summary, volcano, per-gene curves, sample density, and per-sample curves.
Call
The pseudobulk is built on the fly from the cell-level AnnData (aggregating cells per sample × cell type), so you pass the preprocessed cell-level adata — not a separate sample-level object. pseudotime_source accepts a dict, a DataFrame, or a path to a CSV/TSV emitted by CCA or TSCAN.
from sampledisco.sample_trajectory.trajectory_diff_gene import (
    run_trajectory_gam_differential_gene_analysis,
)

results_df = run_trajectory_gam_differential_gene_analysis(
    adata,                               # cell-level preprocessed AnnData
    pseudotime_source=expr_pseudotime,   # dict, DataFrame, or CSV/TSV path from CCA/TSCAN
    sample_col="sample",
    celltype_col="cell_type",
    pseudotime_col="pseudotime",
    covariate_columns=None,
    fdr_threshold=0.01,
    effect_size_threshold=1.0,
    top_n_genes=100,
    num_splines=5,
    spline_order=3,
    output_dir="sampledisco_demo_output/rna/trajectoryDEG/expression",
    generate_visualizations=True,
    n_clusters=3,
    top_n_genes_for_curves=20,
    anchor_col=None,                     # orient pseudotime so UP/DOWN are stable
)
Output
Writes → sampledisco_demo_output/rna/trajectoryDEG/expression/:
| File | Shows |
|---|---|
gam_all_genes_<ts>.tsv |
Full per-gene result table before filtering. |
gam_significant_<ts>.tsv |
Genes below fdr_threshold. |
gam_pseudoDEGs_<ts>.tsv |
Selected pseudoDEG table (gene, effect size, p-value, FDR, regulation). |
gam_summary_<ts>.txt |
Run summary (thresholds, counts, UP/DOWN split). |
visualizations/01_results_summary.png |
One-page diagnostic. |
visualizations/02_tde_heatmap.png |
Clustered gene-expression heatmap along pseudotime. |
visualizations/04_volcano_plot.png |
Effect size vs −log10(FDR). |
visualizations/05_gene_curves.png |
GAM fits for the top genes. |
visualizations/06_sample_density.png |
Sample distribution along pseudotime. |
visualizations/08_sample_level_curves.png |
Per-sample raw + fitted curves. |
Result
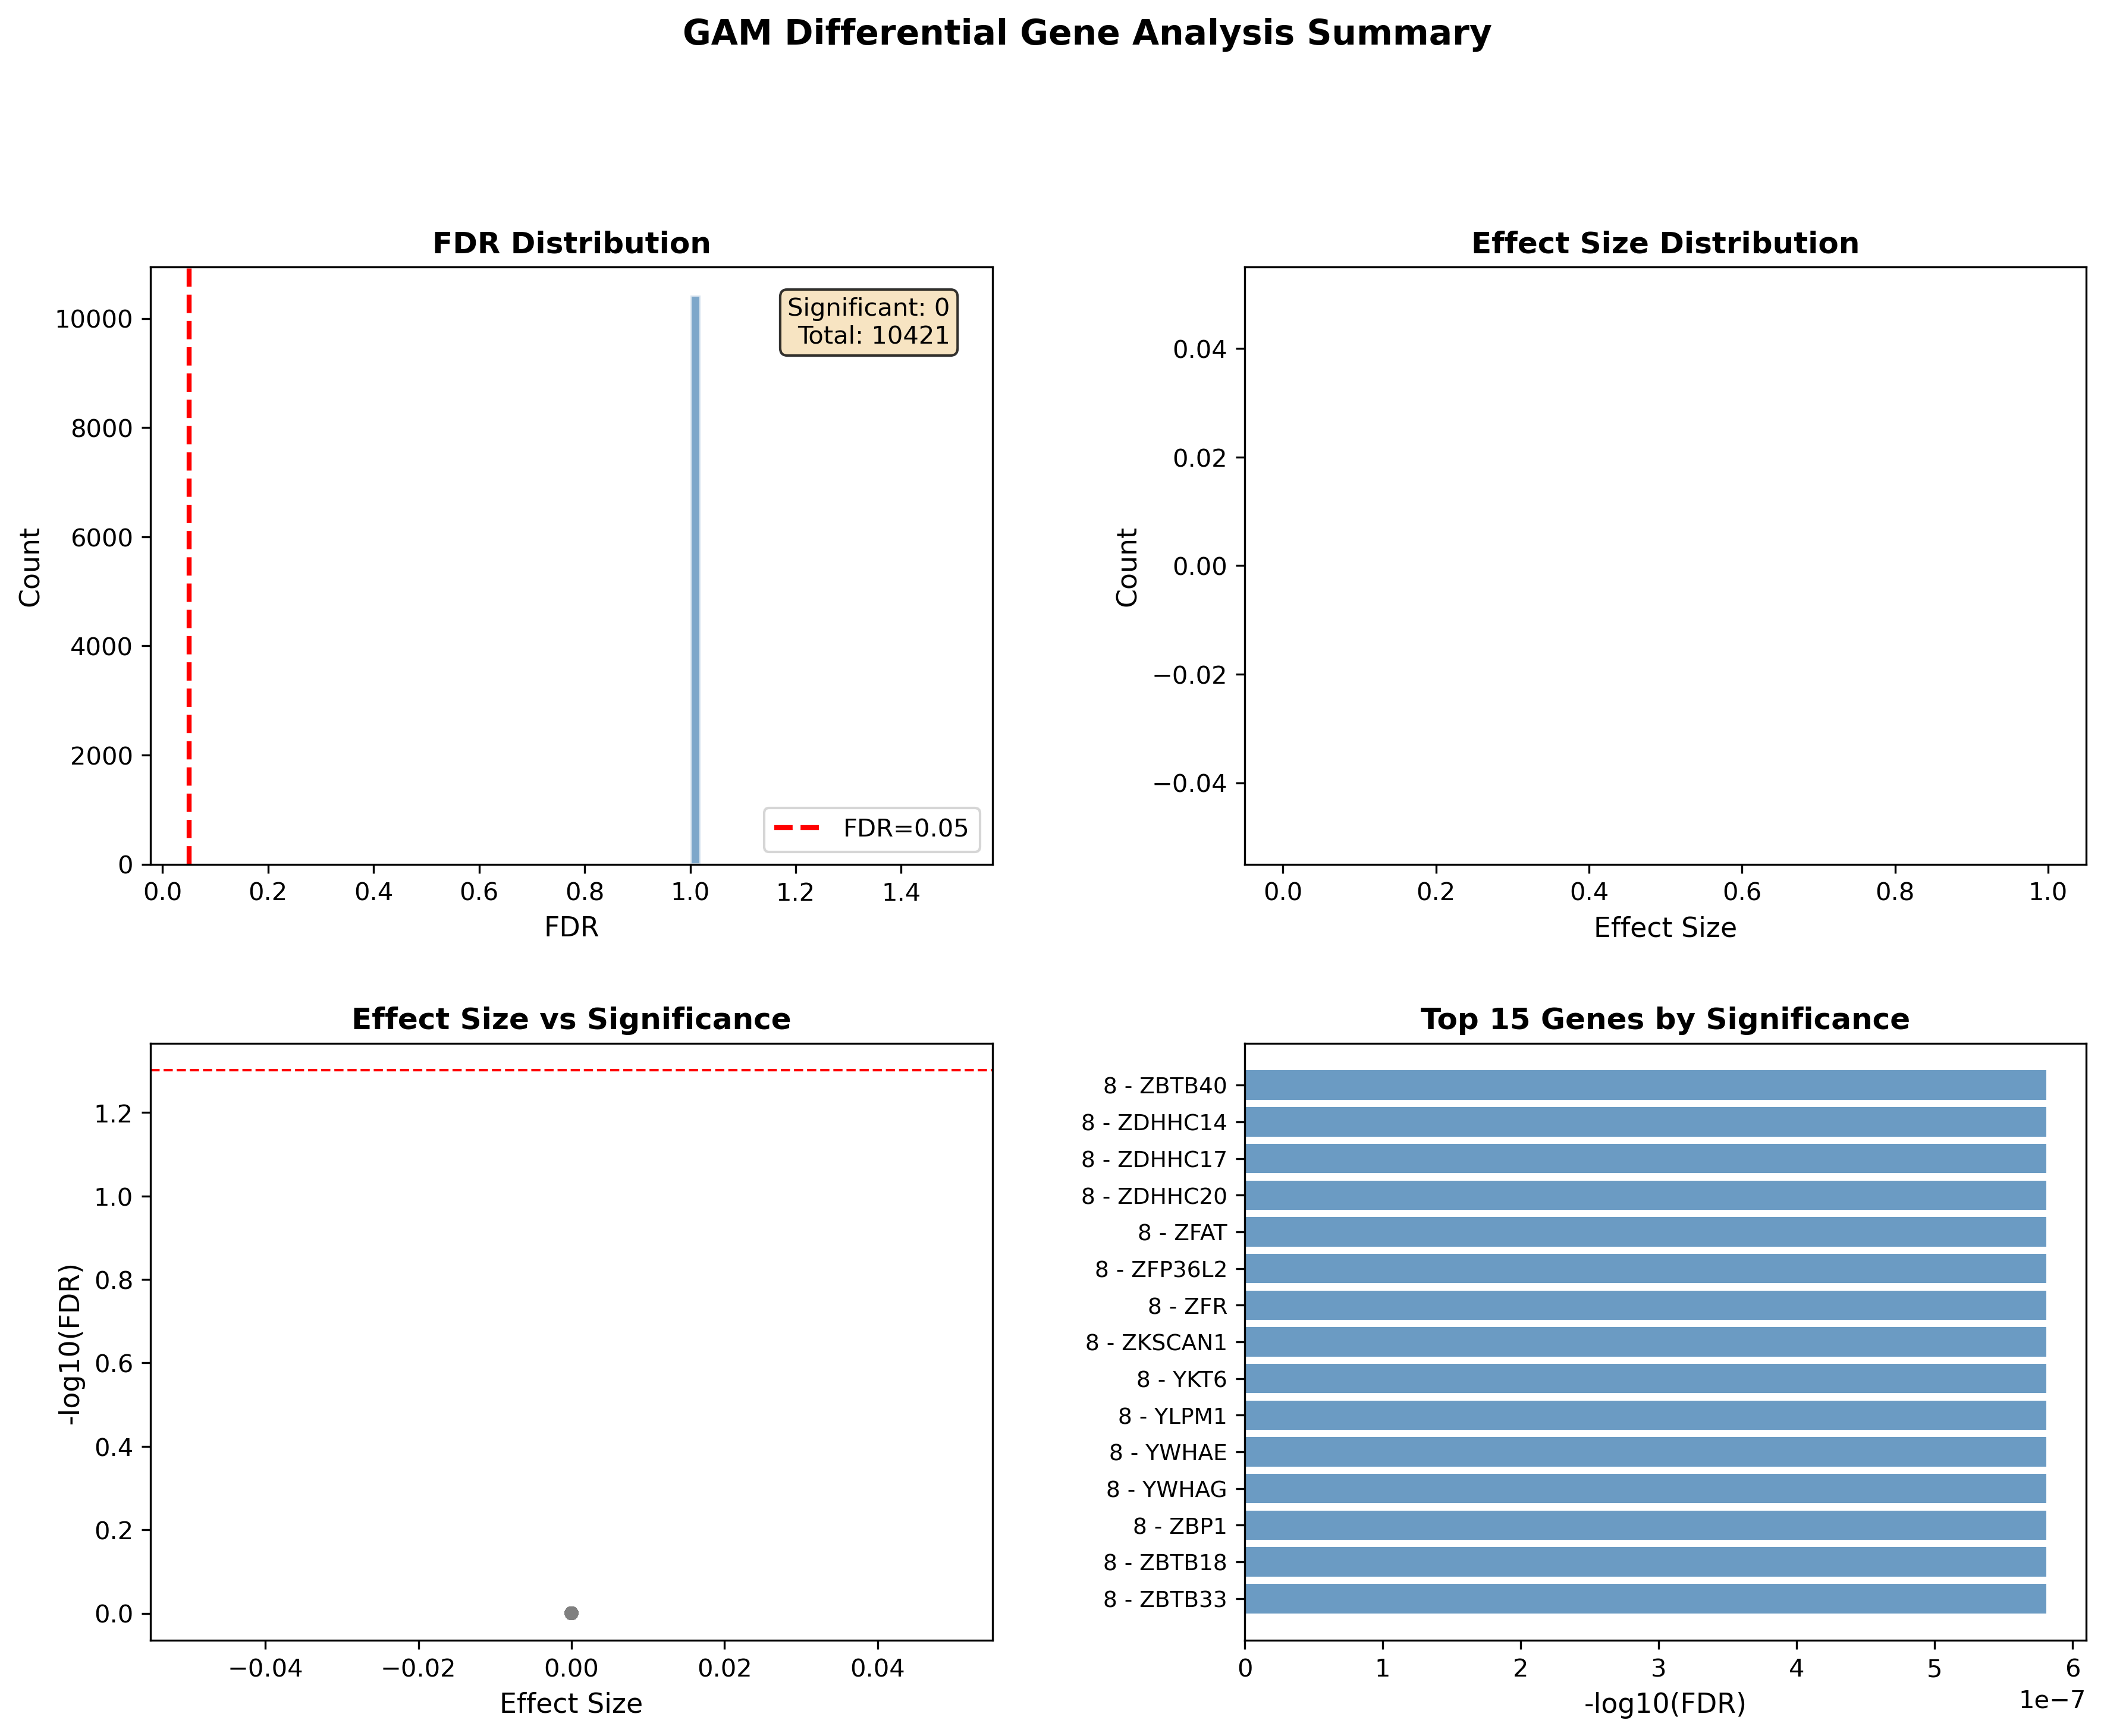
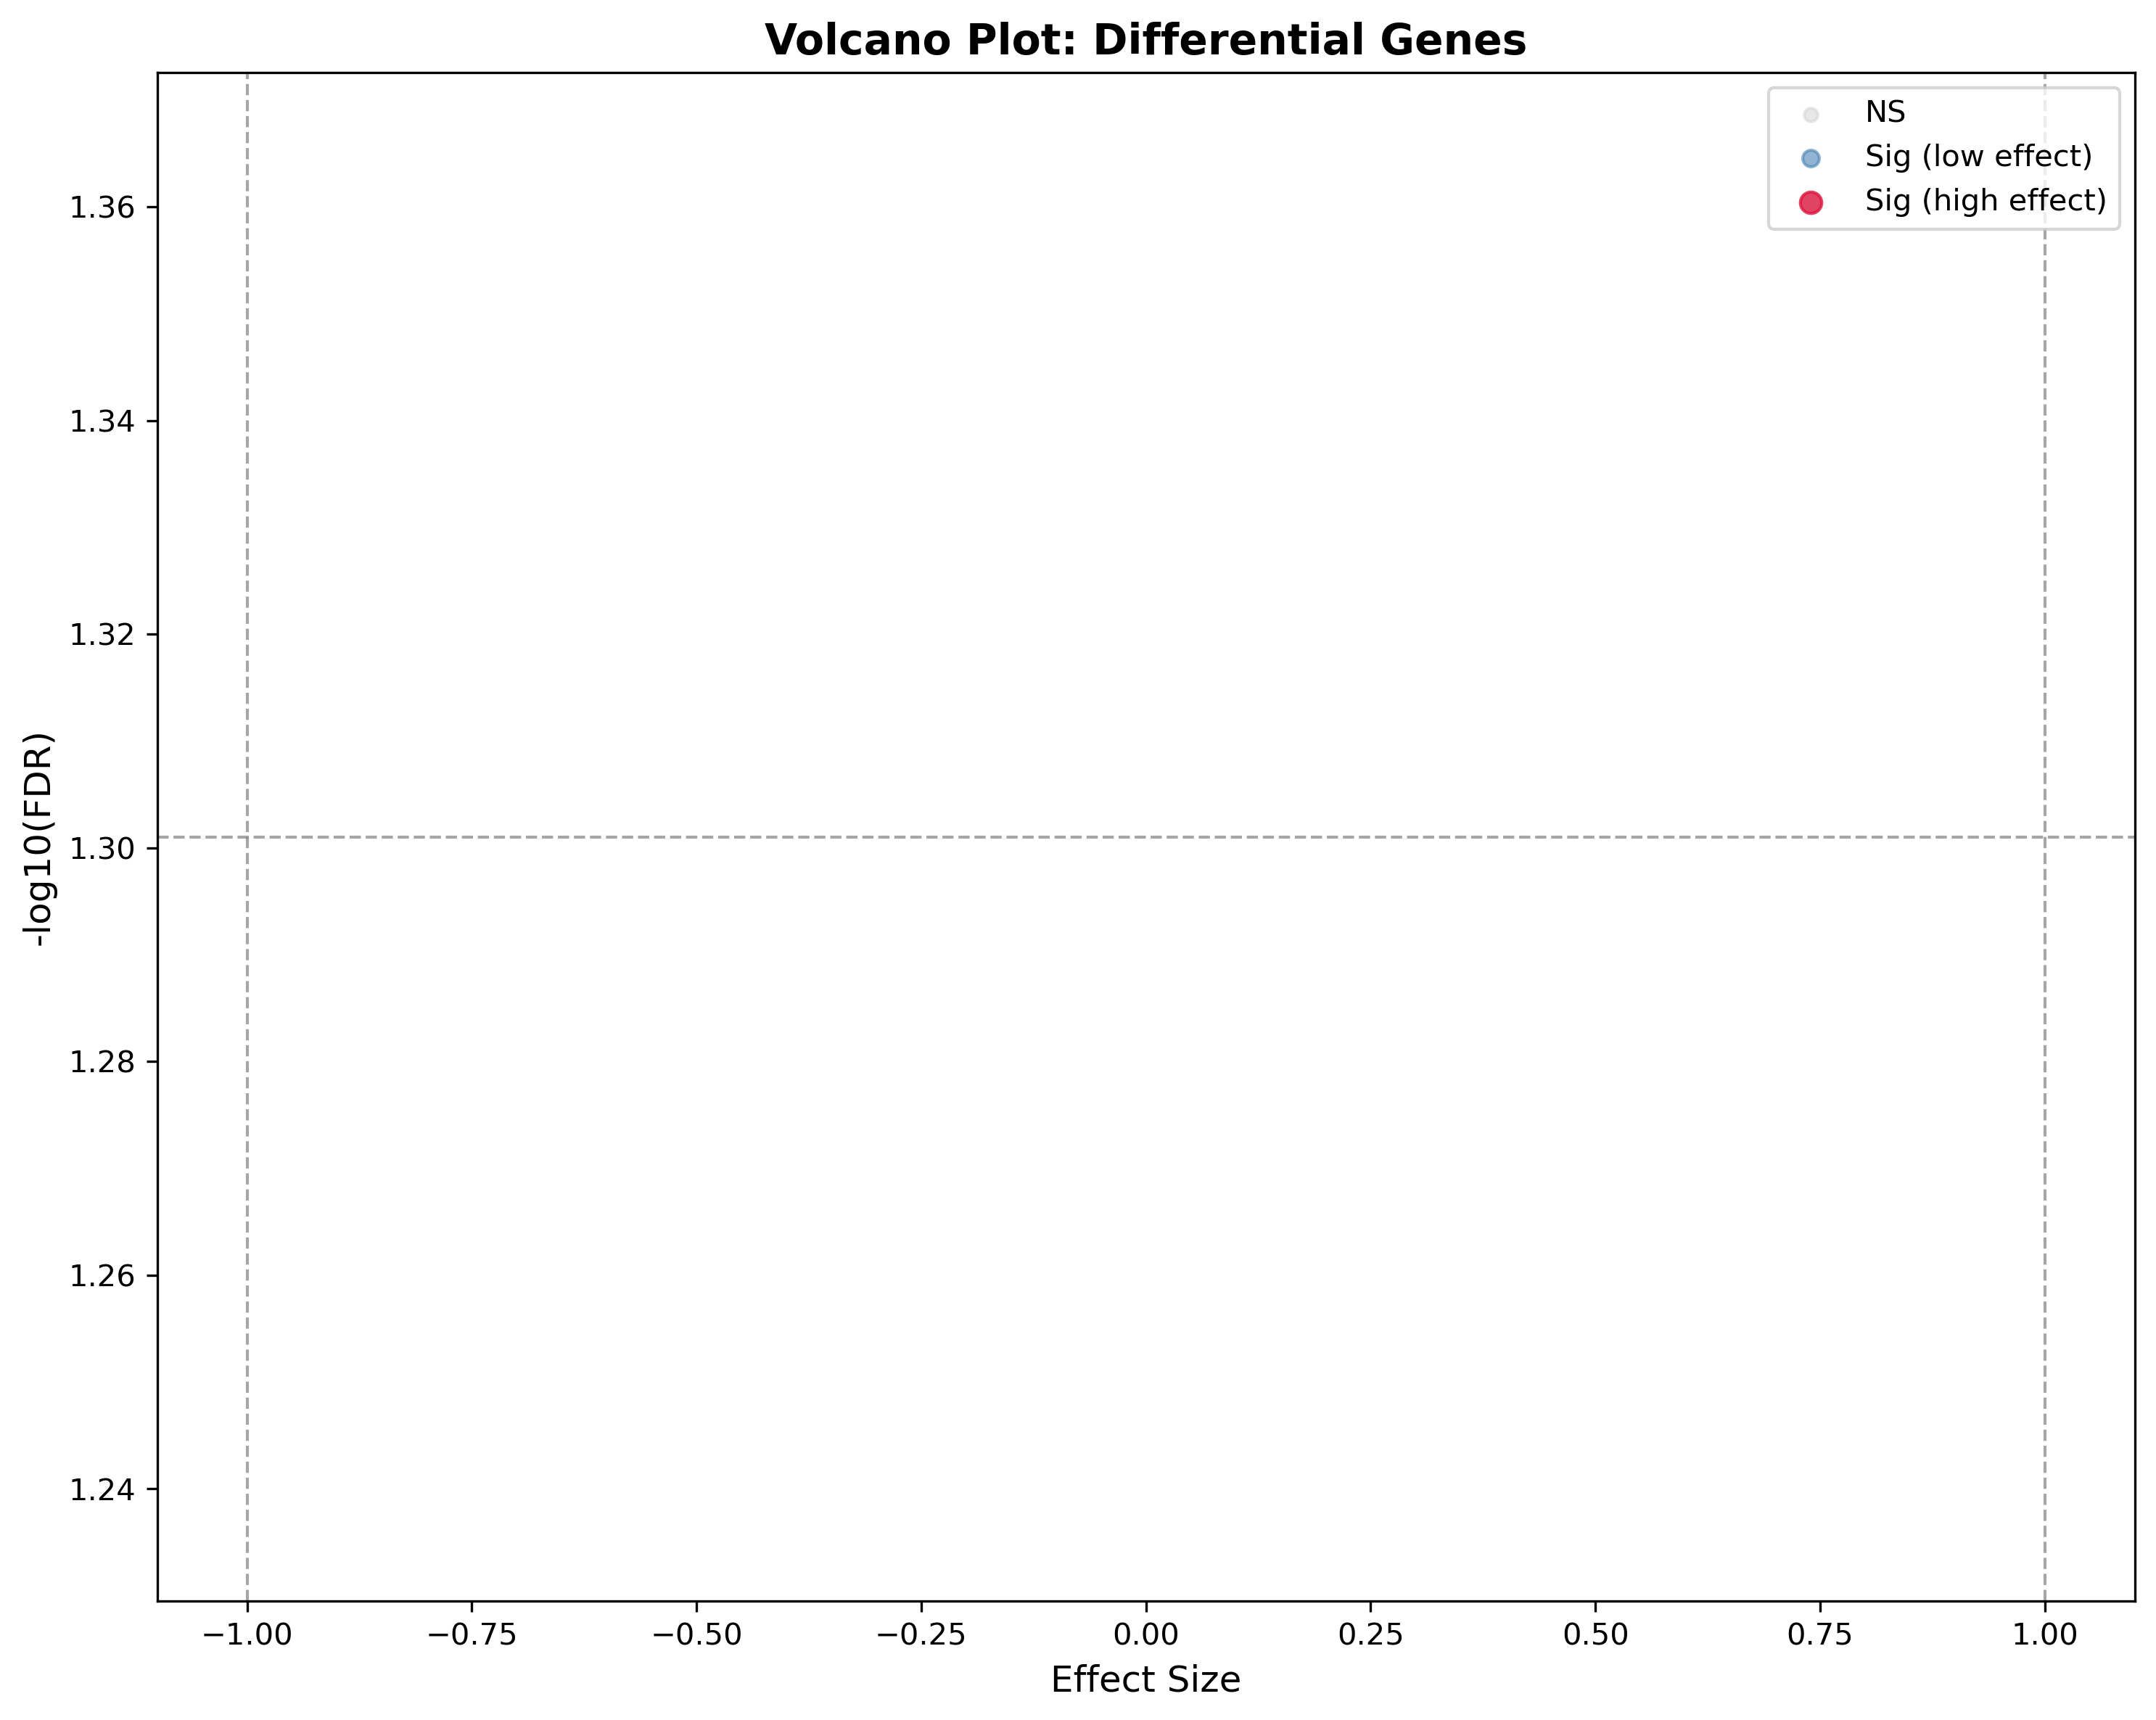
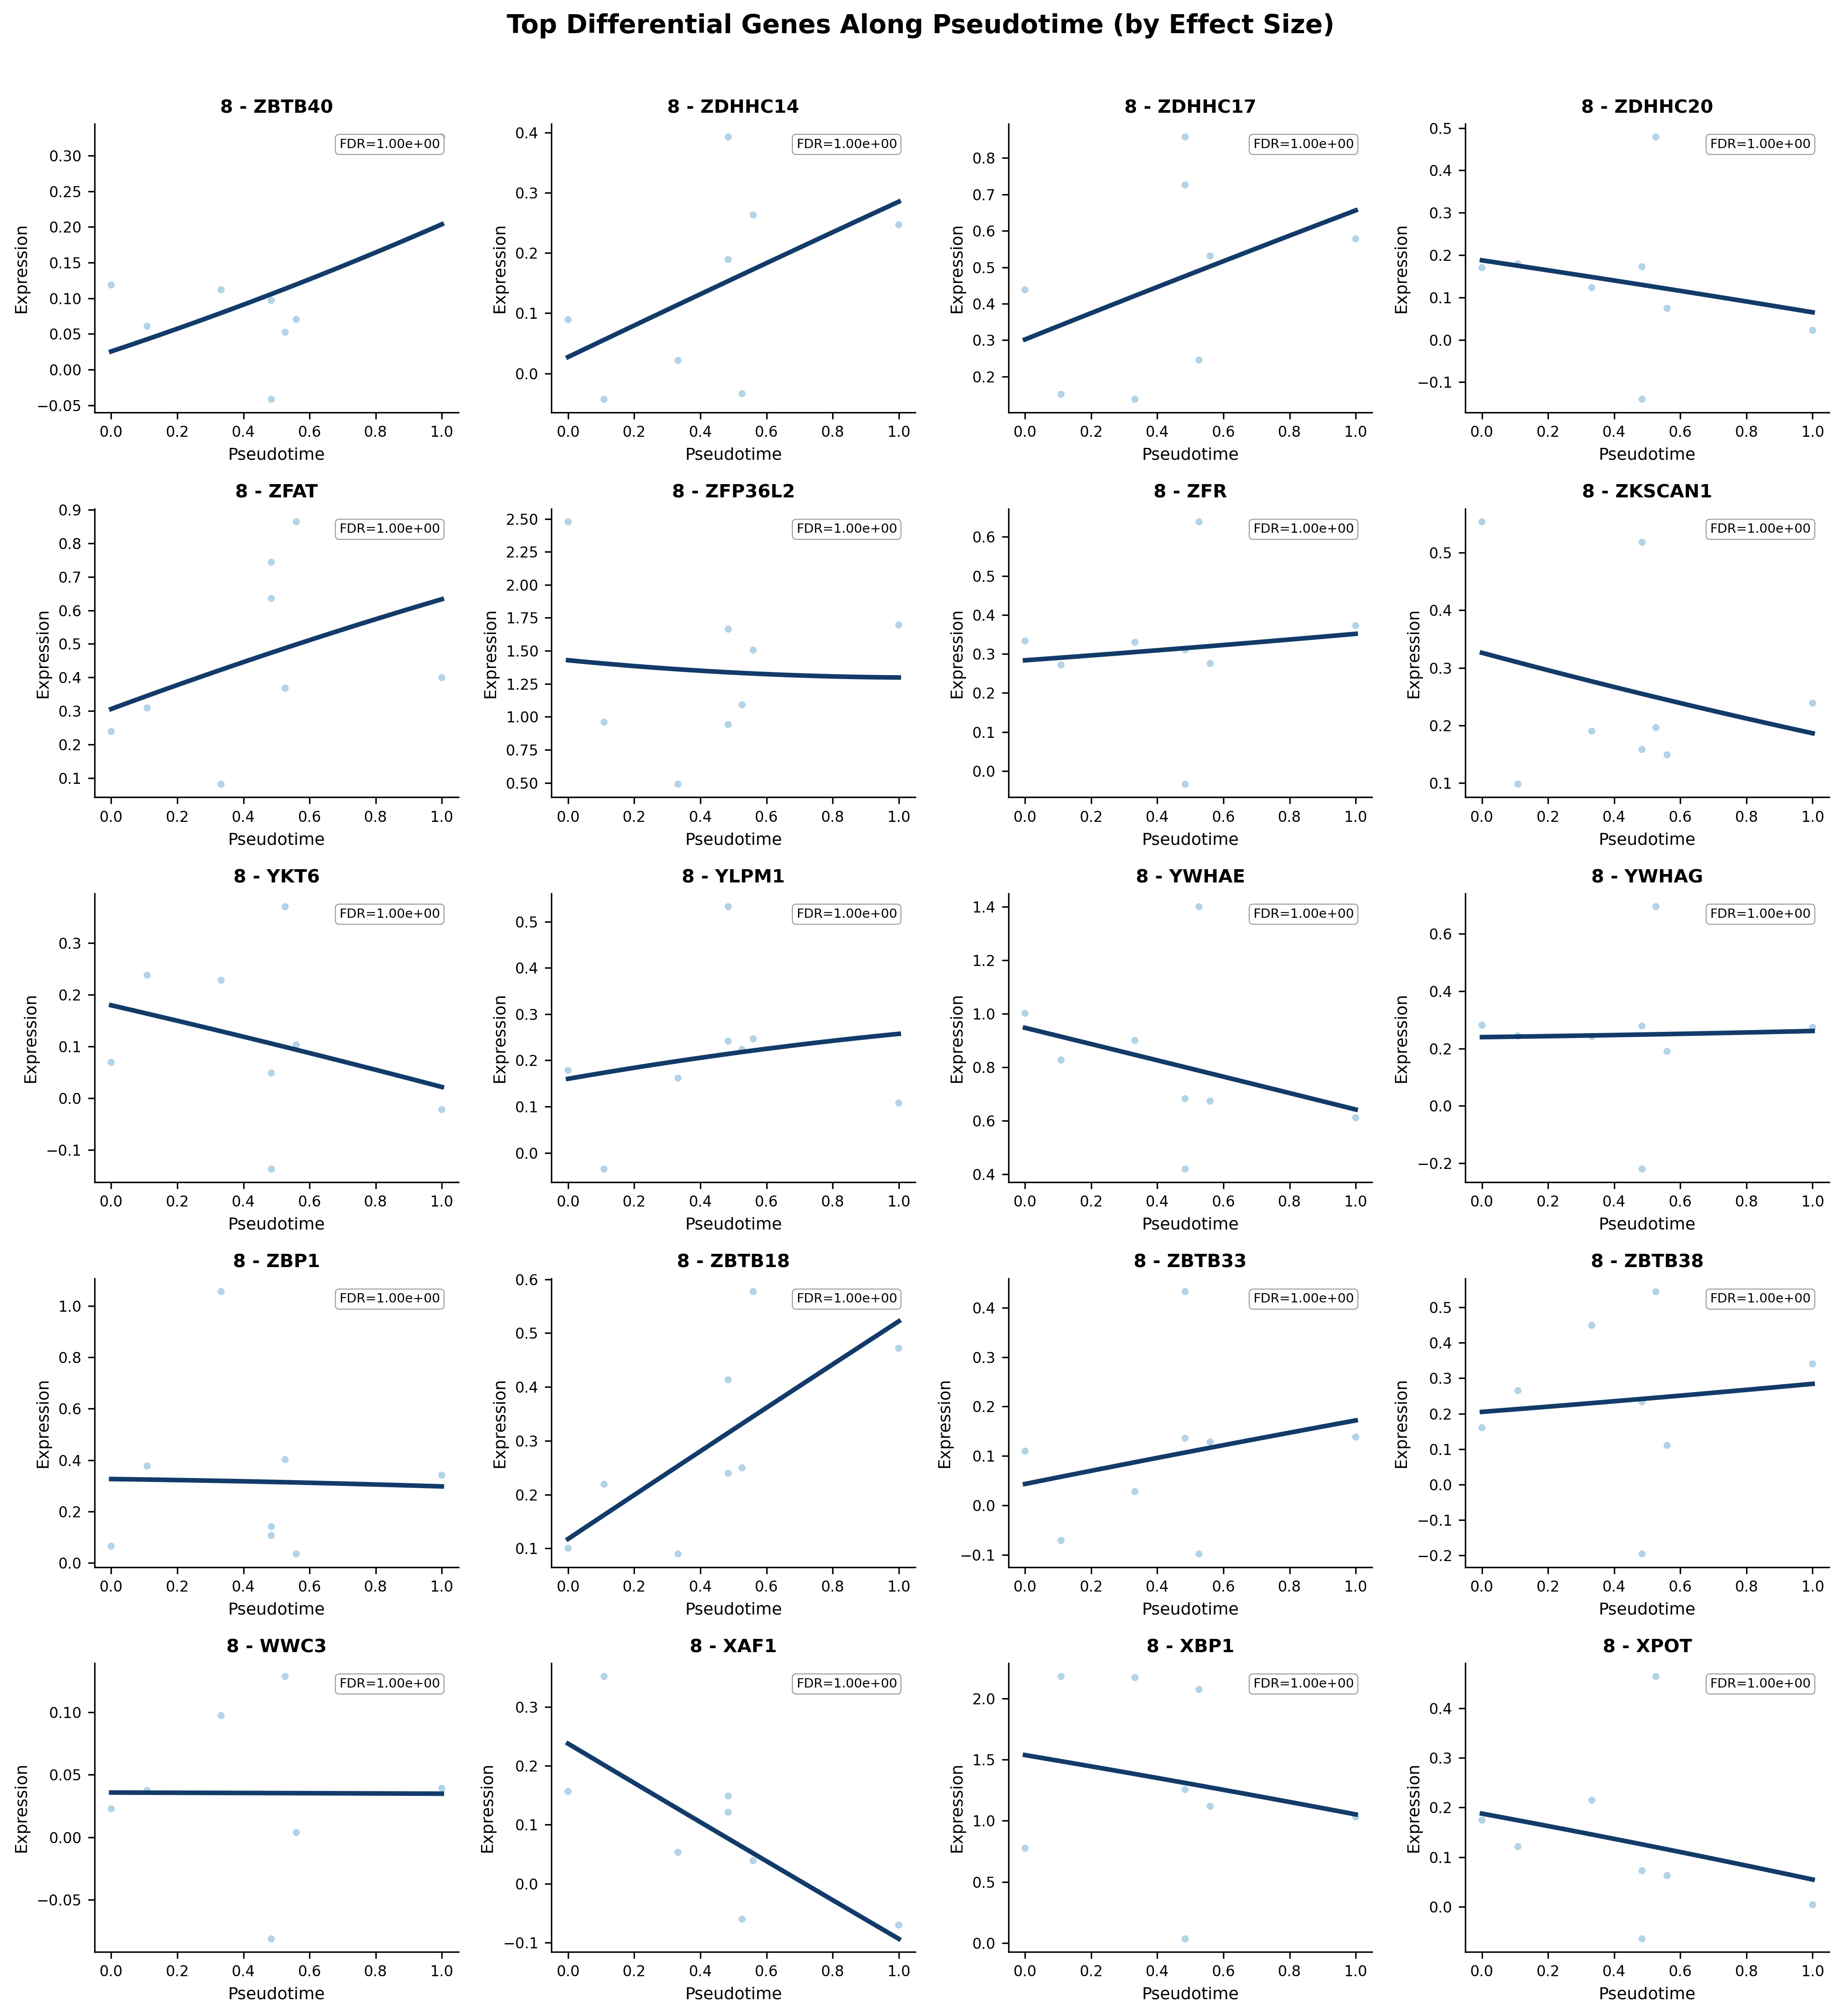
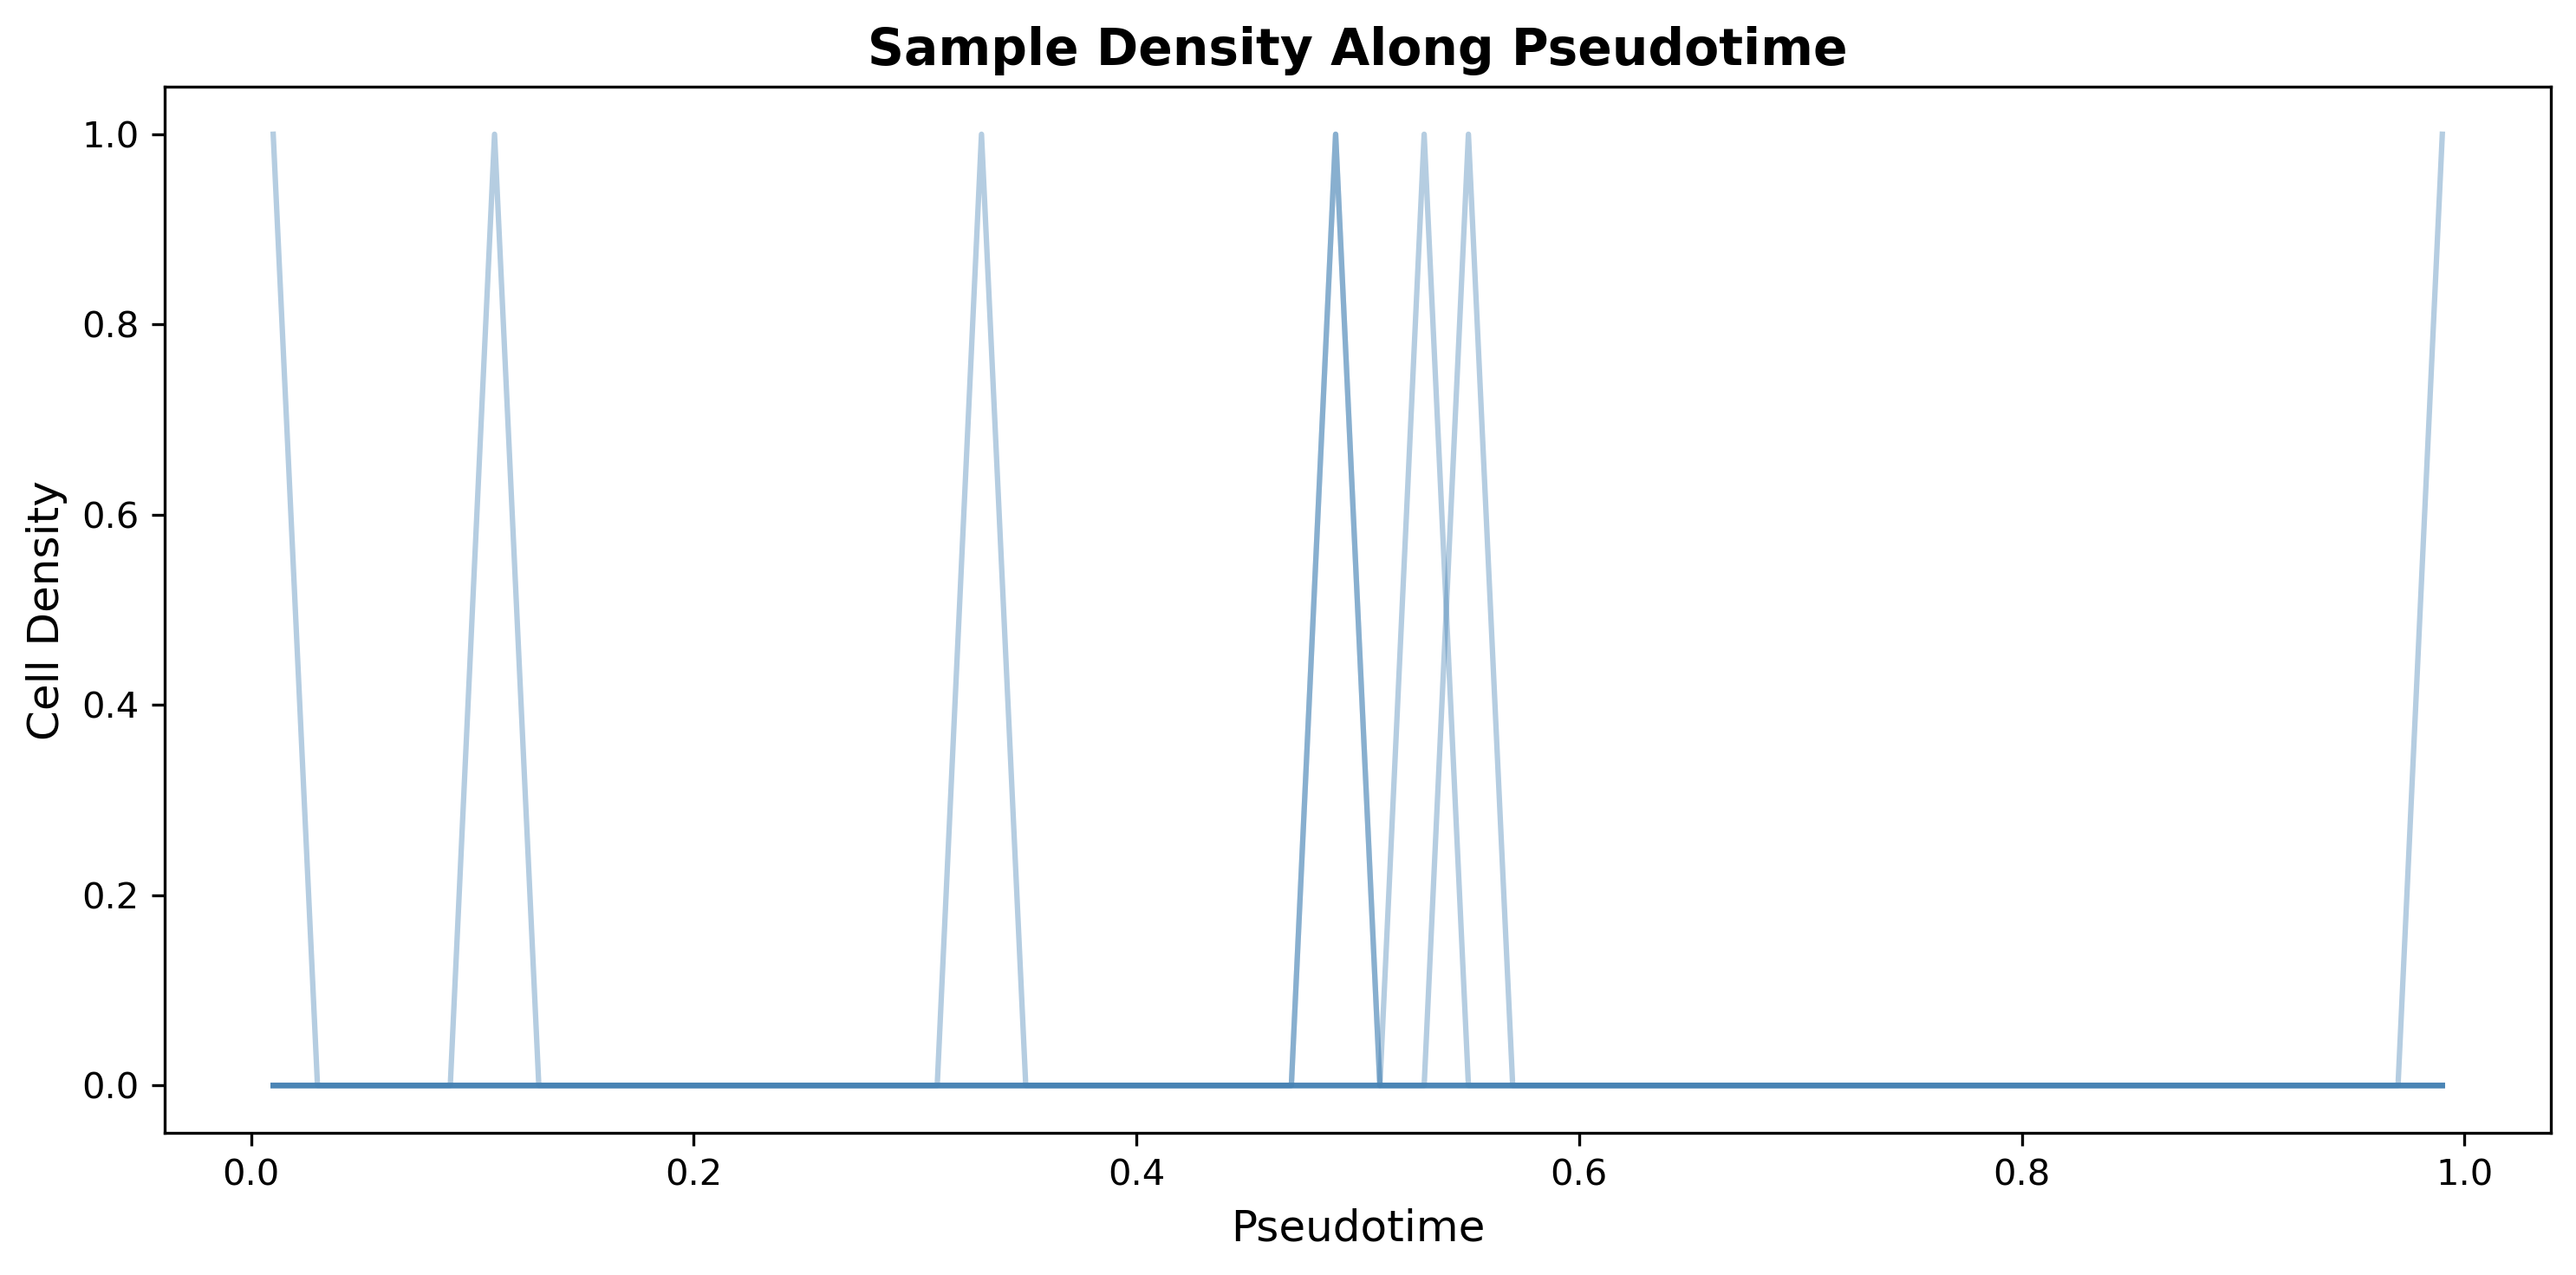
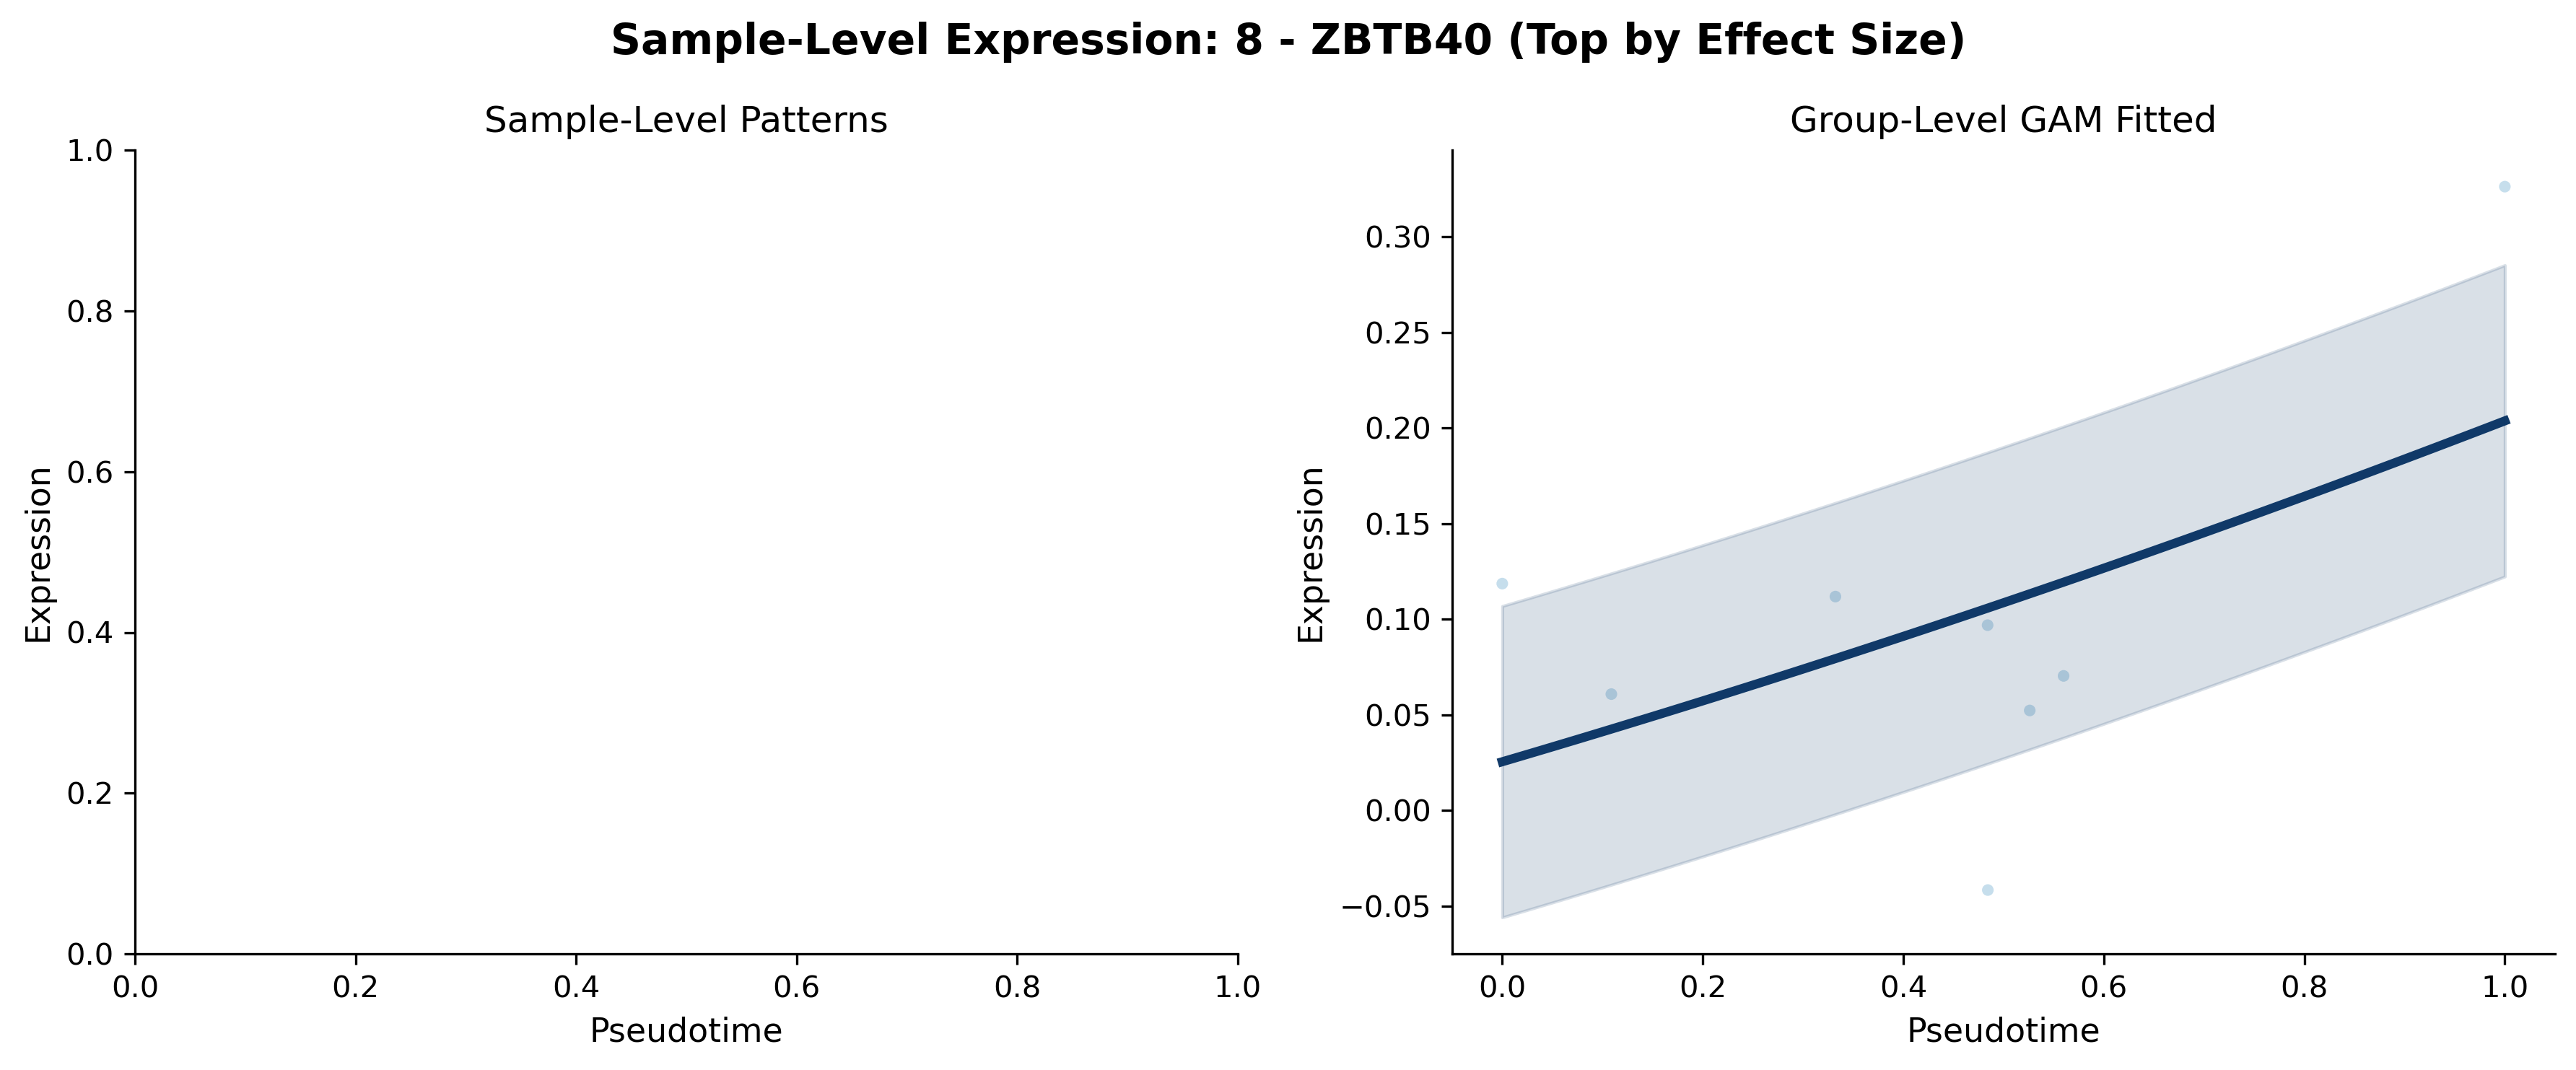
Visualizations from the GAM-based trajectory DGE step.
See the API page for the full parameter list.