General visualization
visualization bundles three diagnostic panels: a cell-type dendrogram, a per-grouping-column PCA of sample cell-type proportions, and a per-grouping-column UMAP of pseudobulk expression. Toggle whichever panels you want.
Call
from sampledisco.visualization.visualization_other import visualization

visualization(
    AnnData_cell=adata_cell,
    pseudobulk_anndata=pseudo_adata,
    output_dir="sampledisco_demo_output/rna/visualization",
    grouping_columns=["sev.level"],
    age_bin_size=None,
    age_column="age",
    plot_dendrogram_flag=True,
    plot_cell_type_proportions_pca_flag=True,
    plot_cell_type_expression_umap_flag=True,
)
Output
Writes → sampledisco_demo_output/rna/visualization/:
cell_type_dendrogram.png— hierarchical tree of cell types by pseudobulk expression.proportion_embedding_{grouping_column}.png— PCA on per-sample cell-type proportions, colored by the grouping.expression_embedding_{grouping_column}.png— UMAP on the expression embedding, colored by the grouping.
Result
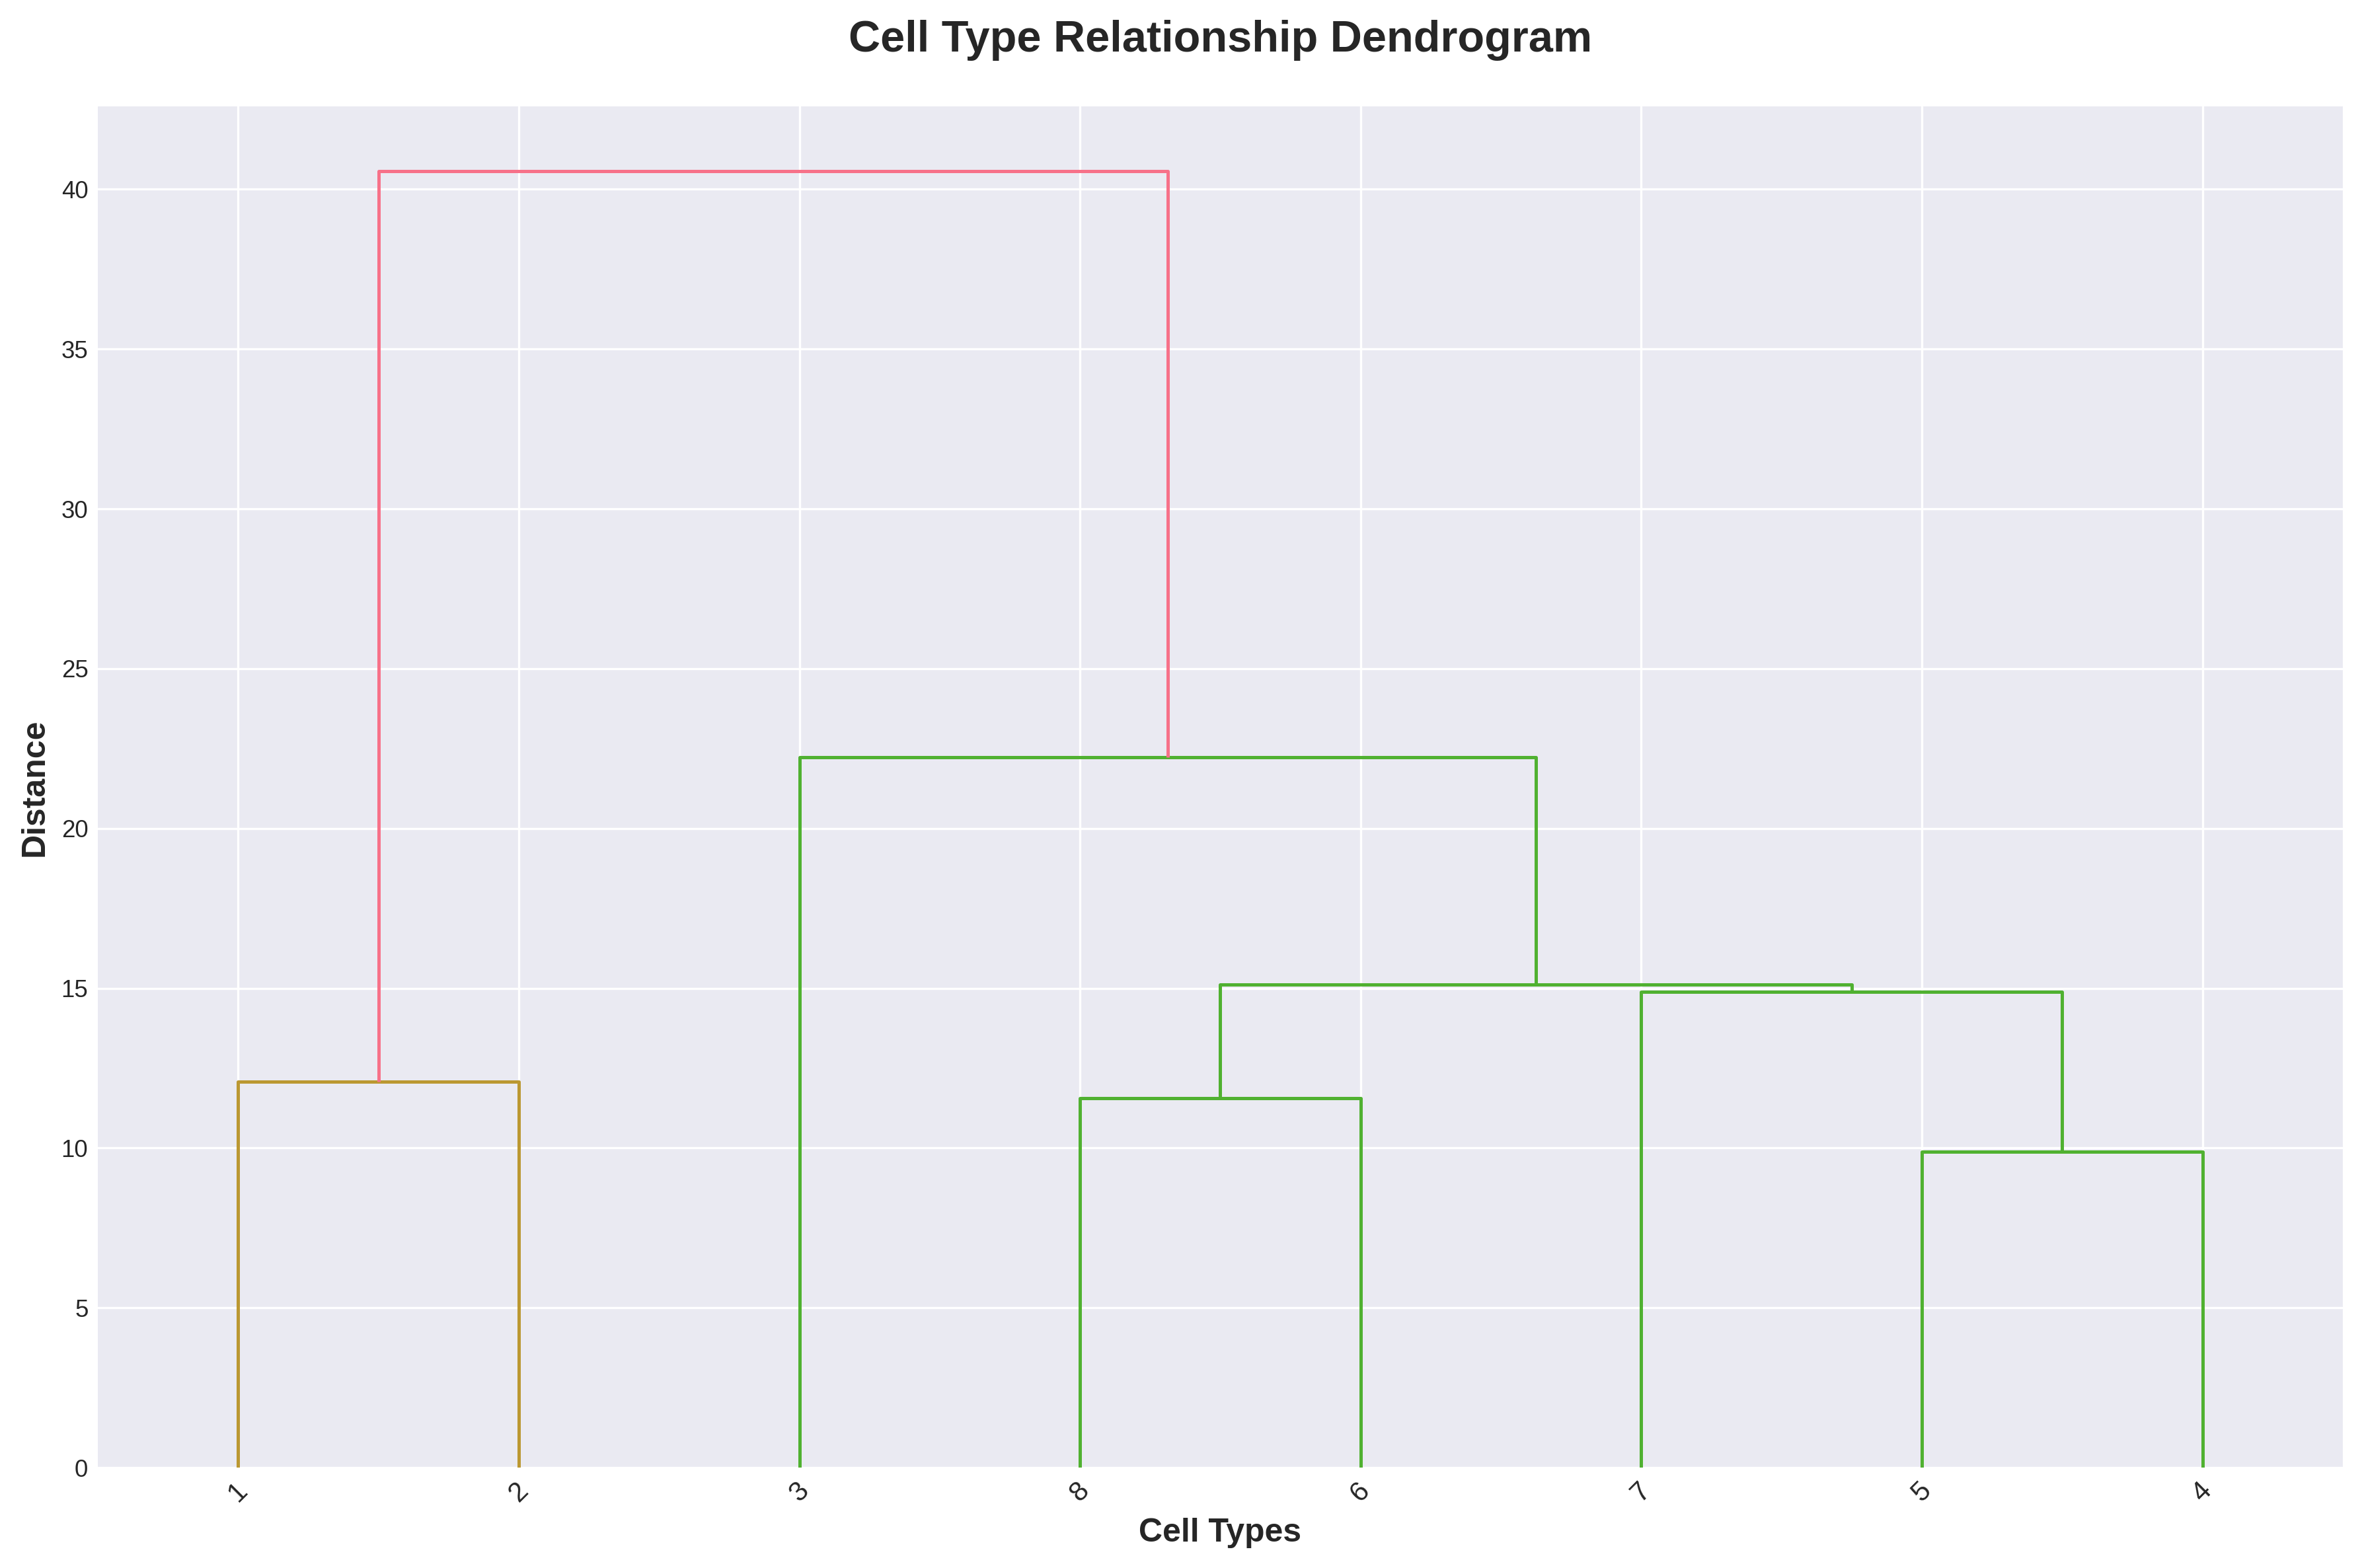
Example dendrogram output. Sub-trees reflect expression similarity between cell types in the pseudobulk.
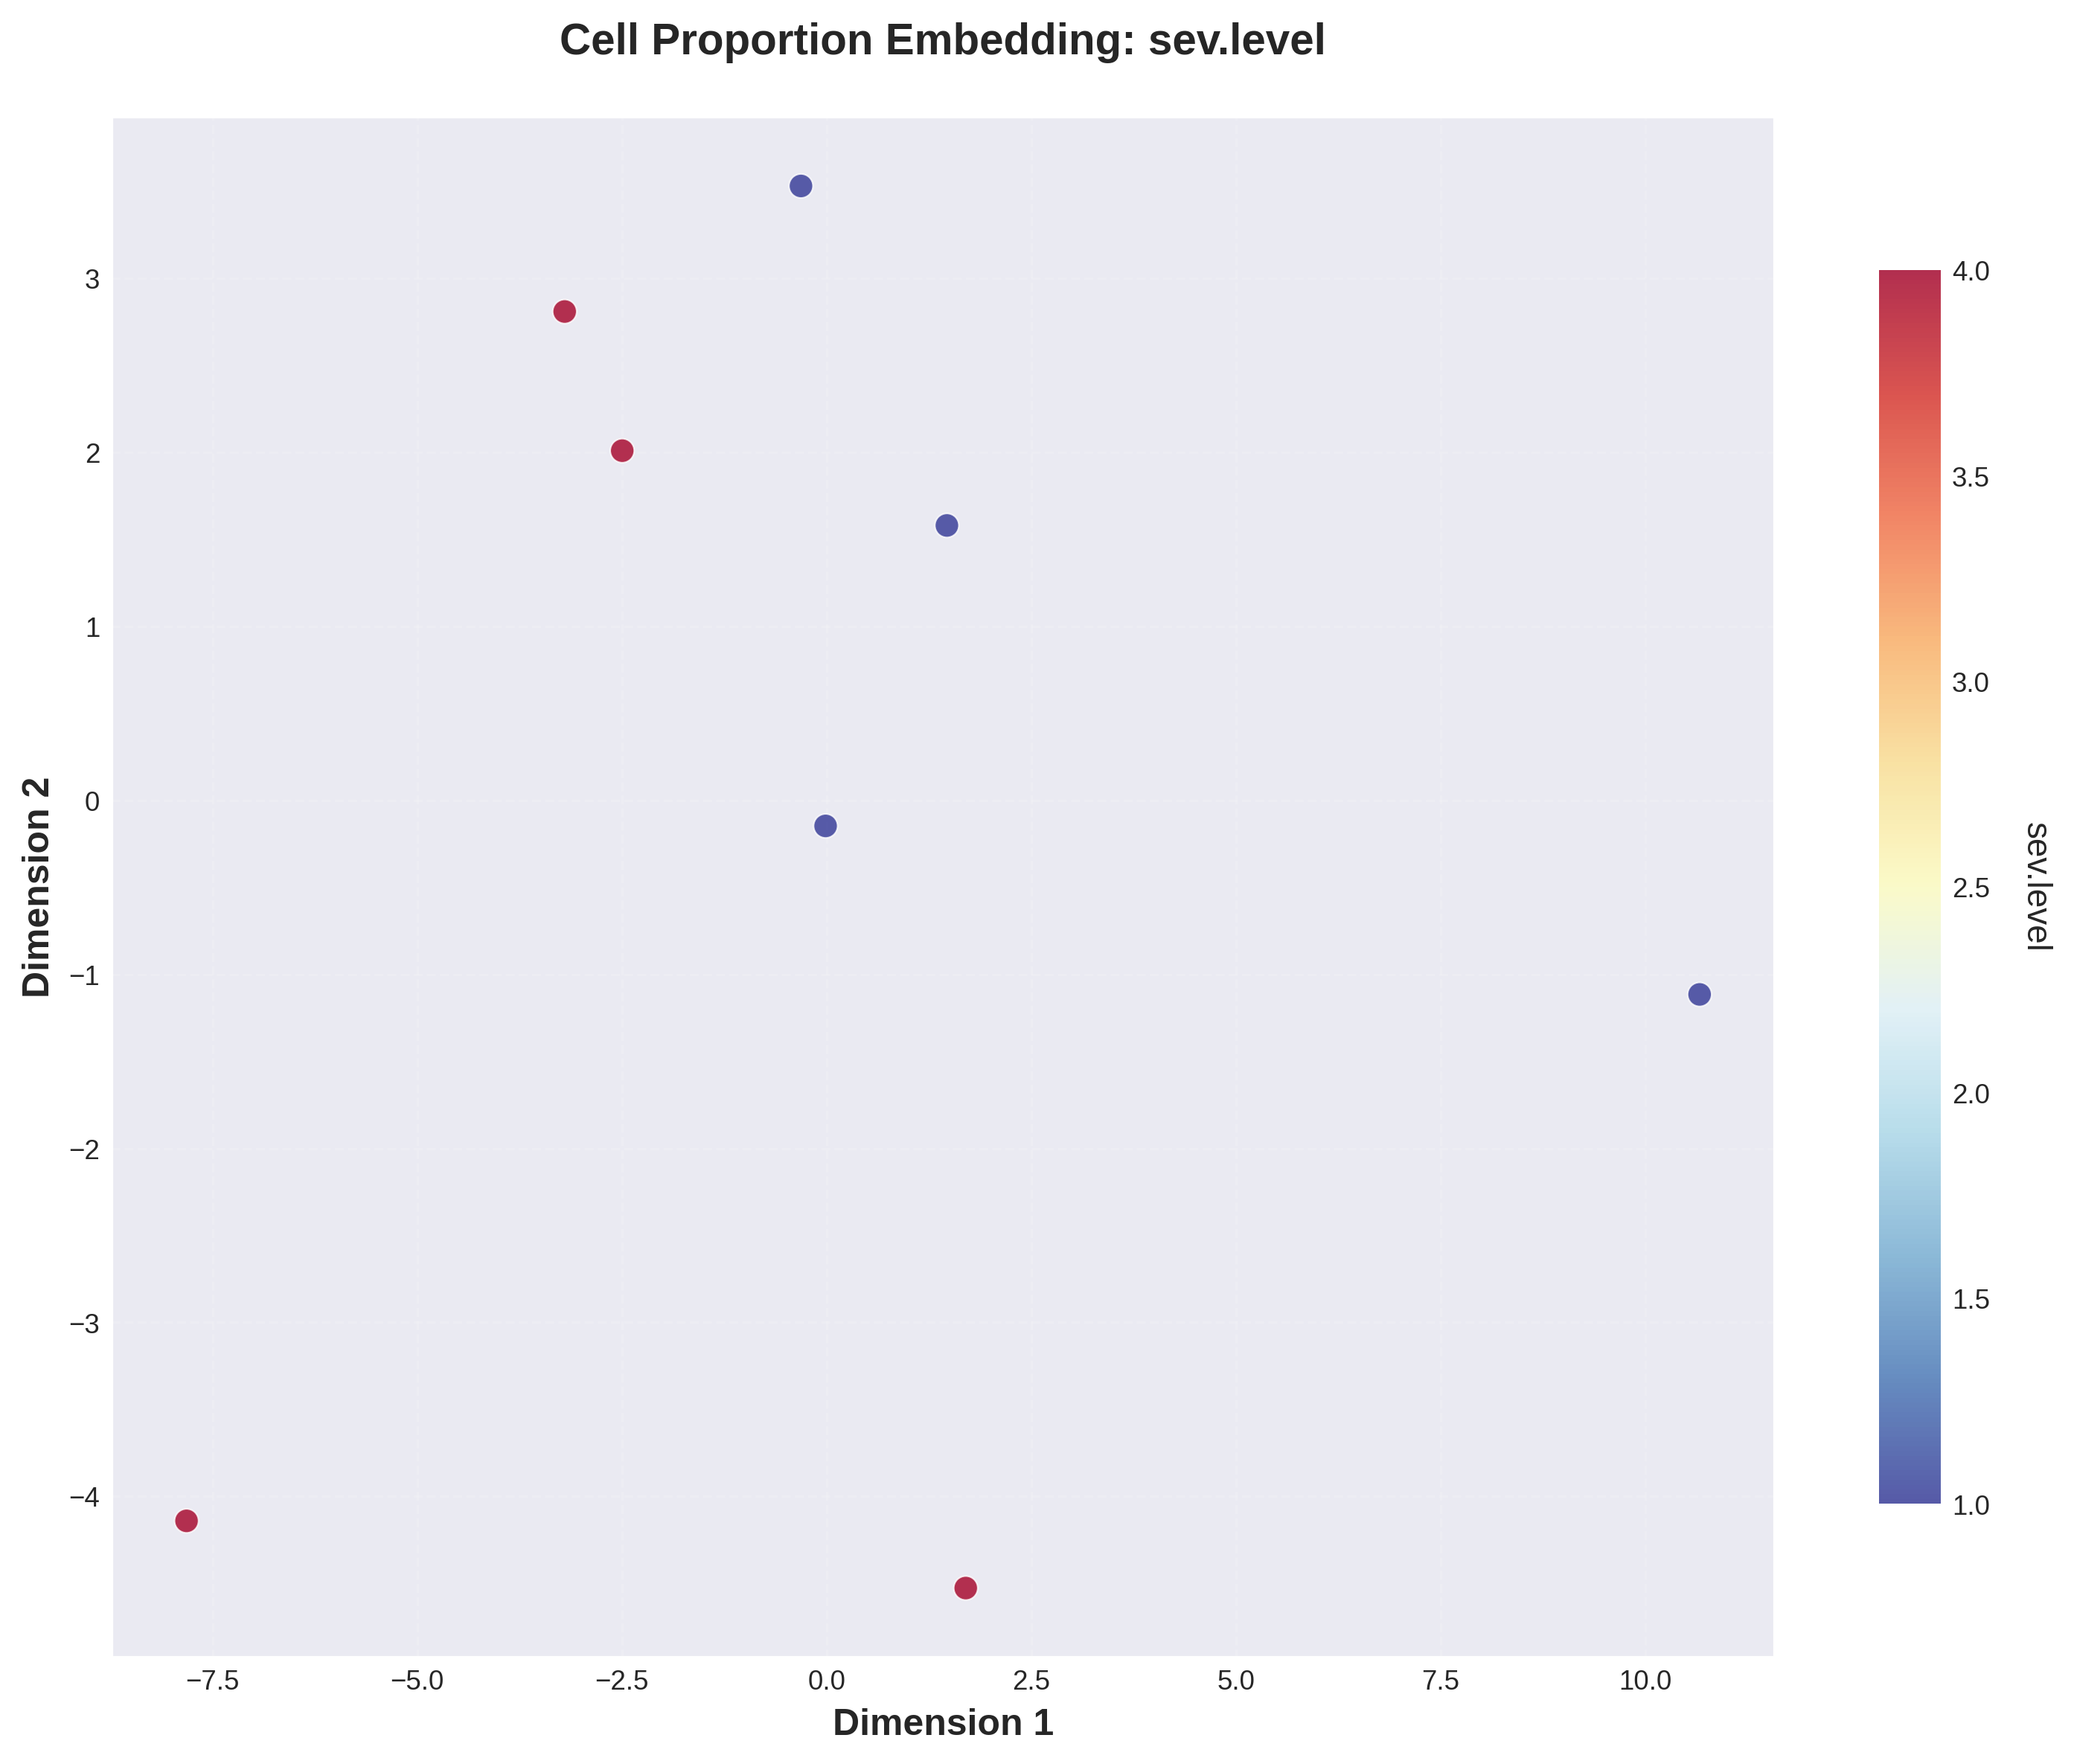
PCA on per-sample cell-type proportions, colored by the grouping.
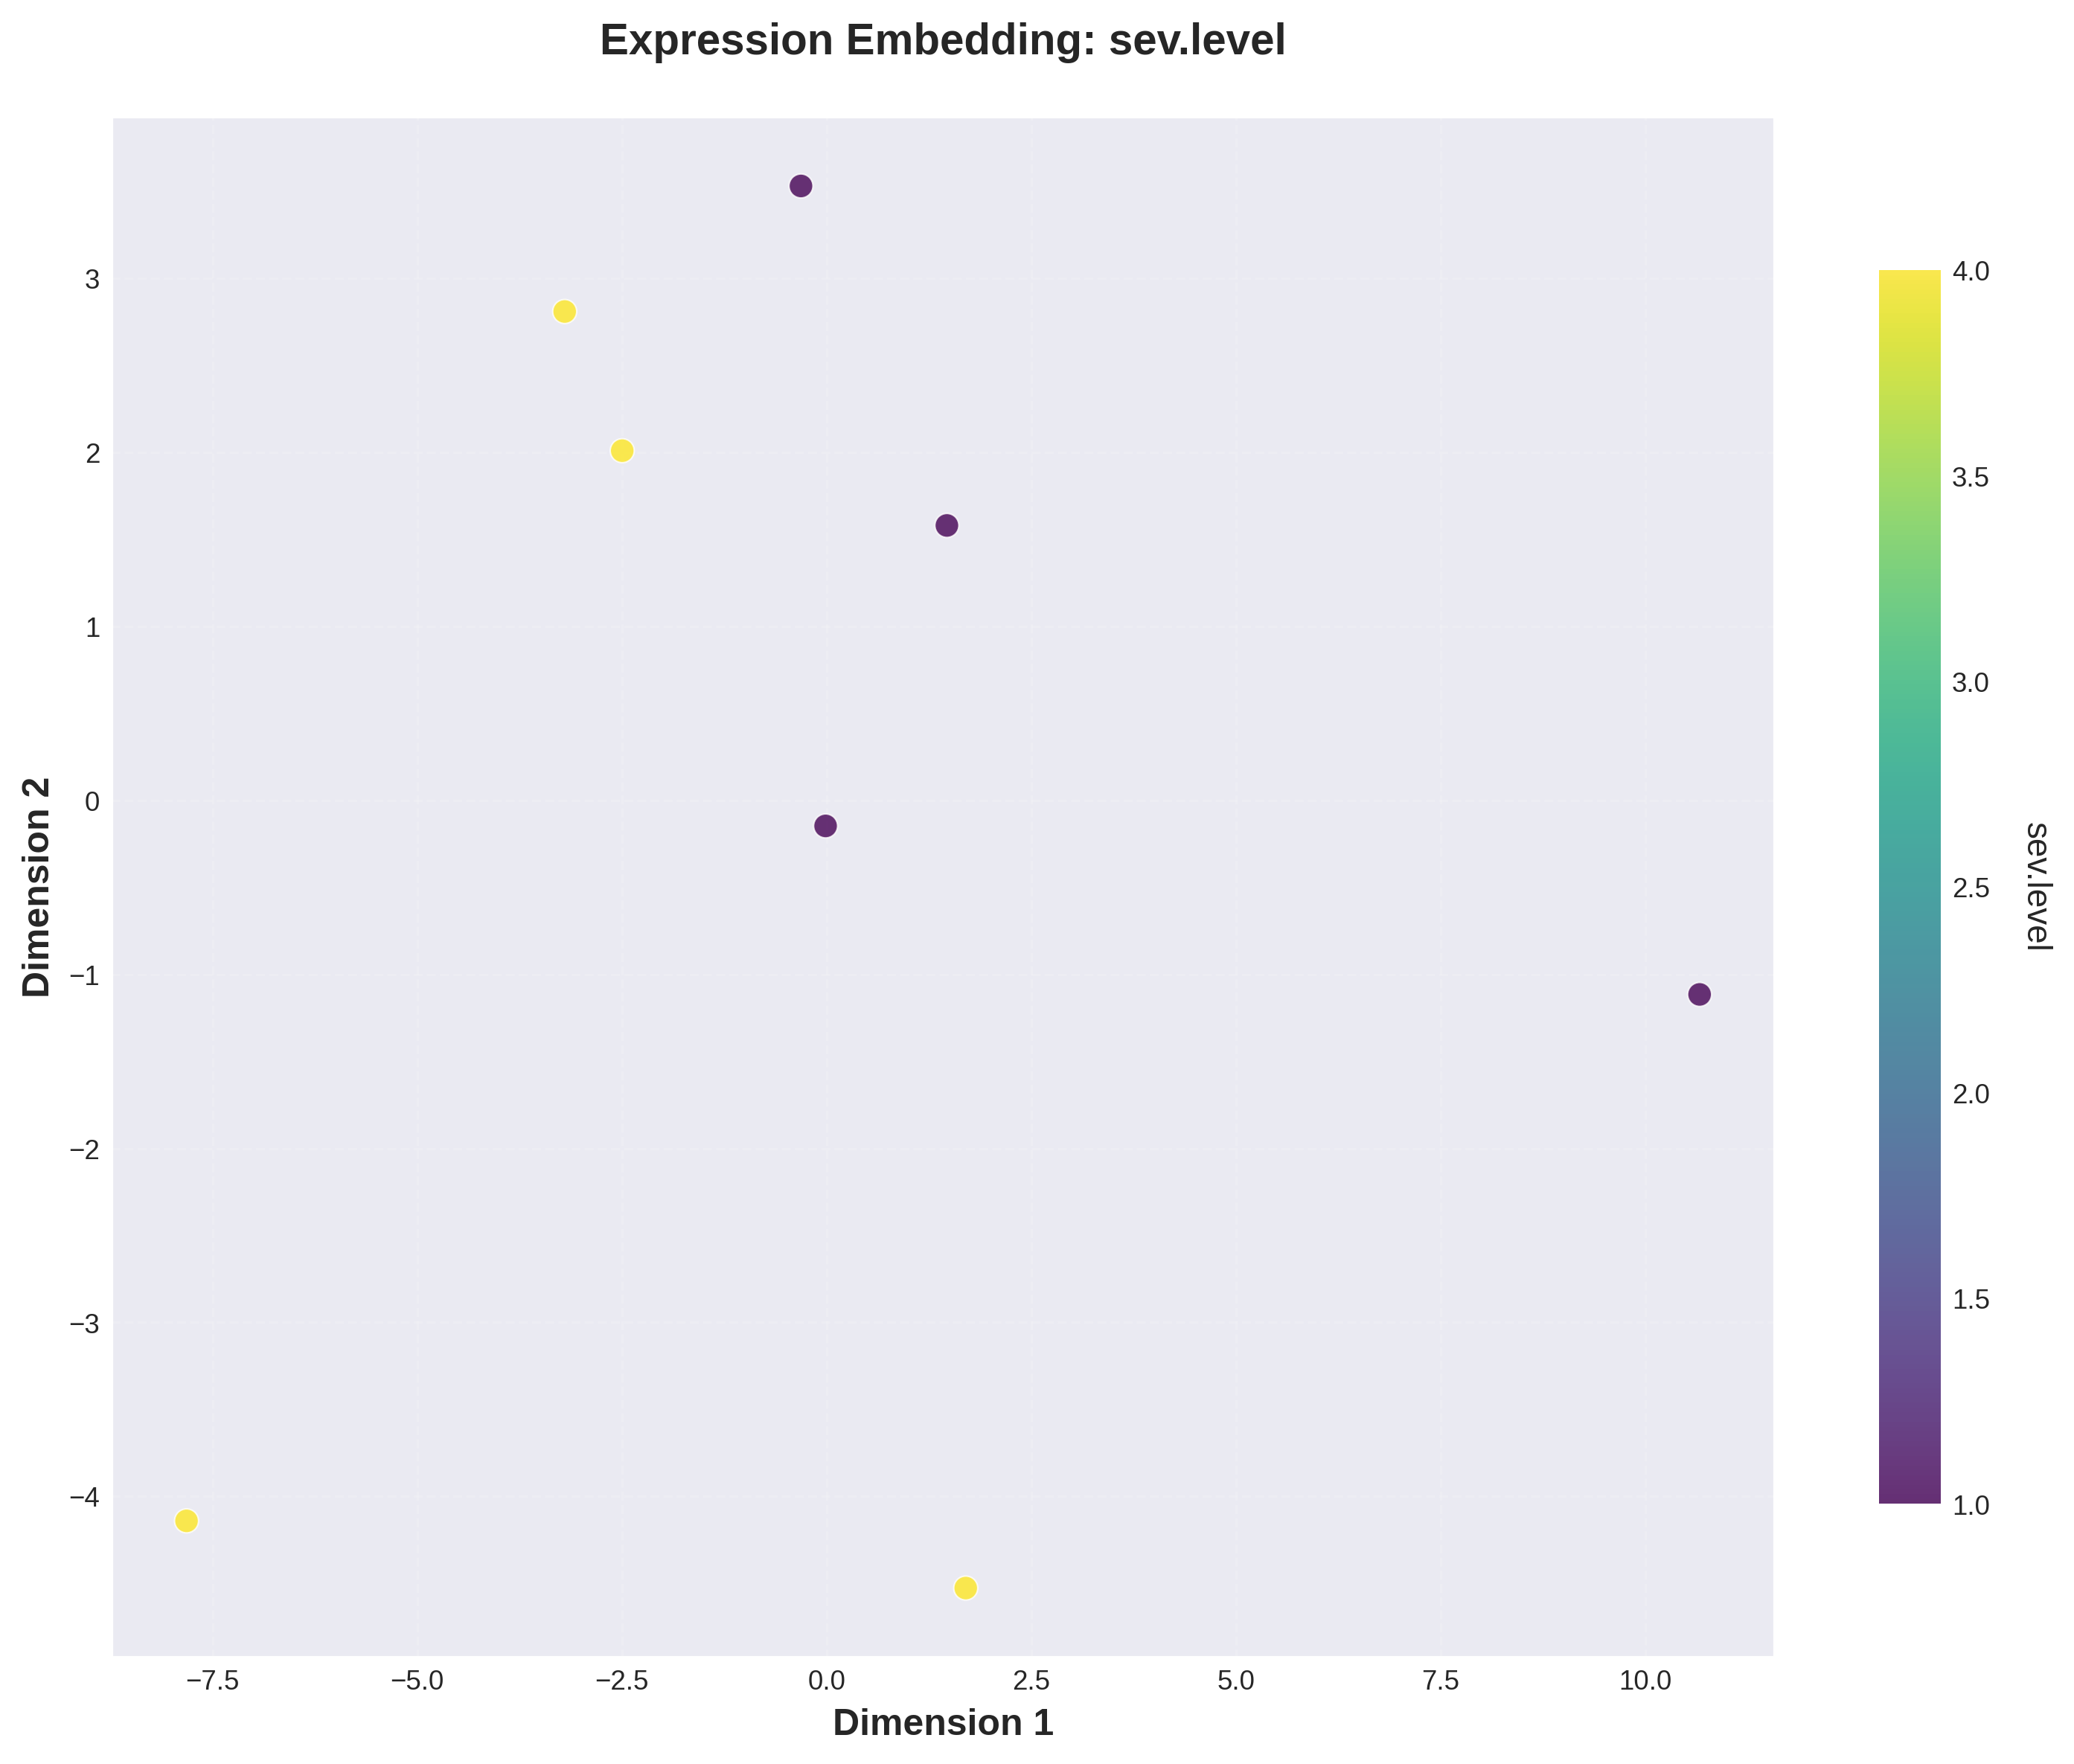
UMAP on the pseudobulk expression embedding, colored by the grouping.
See the API page for the full parameter list.