Dimension association
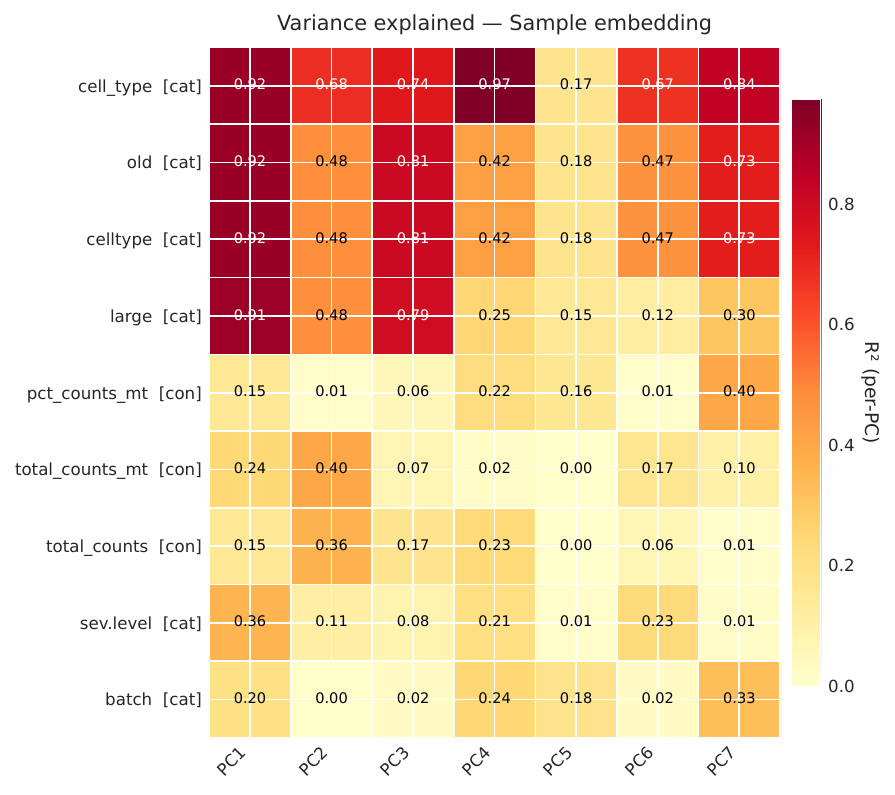
run_dimension_association_analysis tells you which sample-level metadata columns explain the variance of each sample-embedding PC. For every variable in pseudo_adata.obs and every component of the sample embedding X_DR_sample, it fits a linear model, computes R², and attaches a permutation p-value. Continuous variables use a 1-D design (R² = squared Pearson correlation); categorical variables use one-hot (R² = one-way ANOVA η²). The output is a single comparable number per (variable, component), which lets you spot confounders and leading covariates before running trajectory or cluster-DGE tests.
Call
from sampledisco.sample_association.association import run_dimension_association_analysis

assoc = run_dimension_association_analysis(
    pseudo_adata=pseudo_adata,
    output_dir="sampledisco_demo_output/rna/sample_association",
    n_permutations=999,
    sample_col="sample",
    random_state=42,
    verbose=True,
)
Leave continuous_cols and categorical_cols as their defaults to let the function auto-classify metadata columns, or pass explicit lists to override.
Single-key sample embedding
The analysis runs on the single sample embedding pseudo_adata.uns['X_DR_sample'] (units × PCs). The function returns a dict with keys results (embedding → DataFrame), continuous_cols, categorical_cols, and dropped_non_sample_level.
Output
Writes → sampledisco_demo_output/rna/sample_association/:
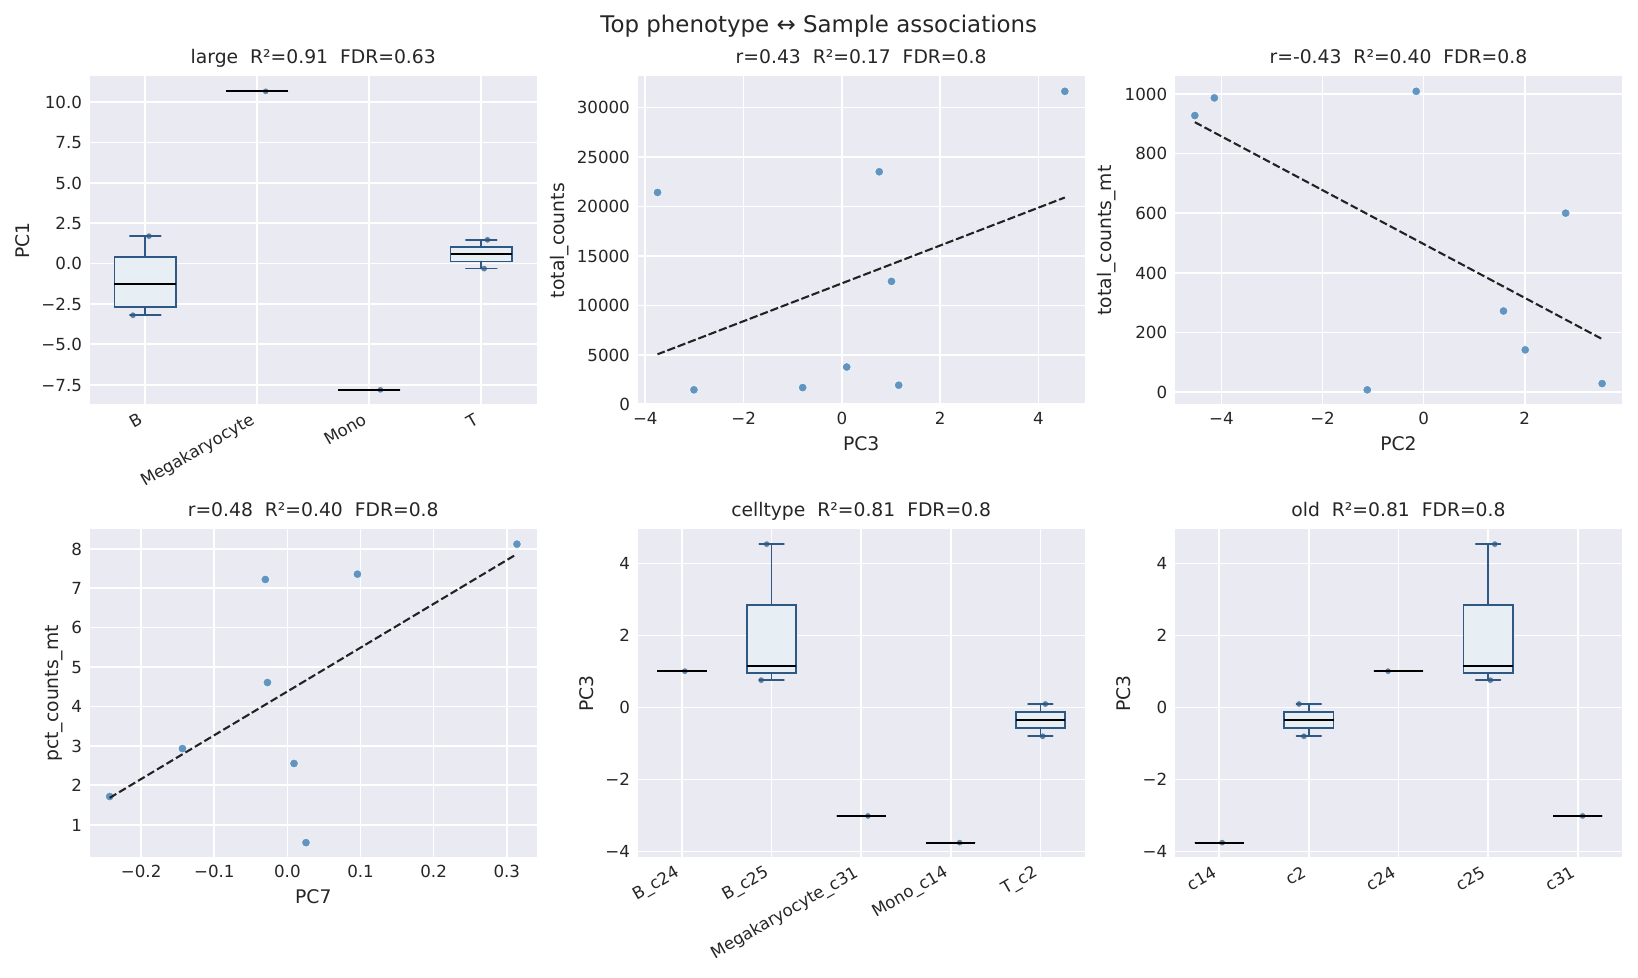
variance_explained_sample.csv— one row per(variable, component)withvariable,component,kind,n_levels,r2,perm_p,fdr,pearson_r,spearman_r,n.figures/sample_variance_heatmap.pdf— variable × component R² heatmap.figures/sample_top_associations.pdf— curated scatter / box panels for the strongest associations.
Result
See the API page for the full parameter list.