Trajectory — CCA (supervised)
Canonical Correlation Analysis projects samples onto the one-dimensional axis most correlated with a phenotype column (e.g. severity, age, disease stage). It runs on the single sample embedding adata.uns['X_DR_sample'], returning the correlation score and per-sample pseudotime values, and visualizes the projection along the two PCs that contribute most to the axis. Pair it with cca_pvalue_test to attach a permutation p-value.
Call
from sampledisco.sample_trajectory.CCA import CCA_Call
from sampledisco.sample_trajectory.CCA_test import cca_pvalue_test

score_a, score_b, ptime_a, ptime_b = CCA_Call(
    adata=pseudo_adata,
    output_dir="sampledisco_demo_output/rna",
    trajectory_col="sev.level",
    n_components=10,
    auto_select_best_2pc=True,
    verbose=True,
)

# Single-key world: both score slots hold the same X_DR_sample result.
cca_pvalue_test(
    pseudo_adata=pseudo_adata,
    column="X_DR_sample",
    input_correlation=score_a,
    output_directory="sampledisco_demo_output/rna",
    num_simulations=1000,
    trajectory_col="sev.level",
)
CCA_Call returns a legacy 4-tuple (score_a, score_b, ptime_a, ptime_b) for back-compat with the wrapper; with the single-key sample embedding both score slots and both pseudotime slots collapse to the same X_DR_sample result.
Output
Writes →
sampledisco_demo_output/rna/CCA/pca_2d_cca_sample.pdf— 2D projection of the sample embedding.sampledisco_demo_output/rna/CCA/pca_2d_cca_sample_contributions.pdf— per-PC contribution to the axis.sampledisco_demo_output/rna/CCA/pseudotime_sample.csv— per-sample pseudotime along the axis.sampledisco_demo_output/rna/CCA_test/cca_pvalue_distribution_X_DR_sample.png— null distribution + observed.
Result
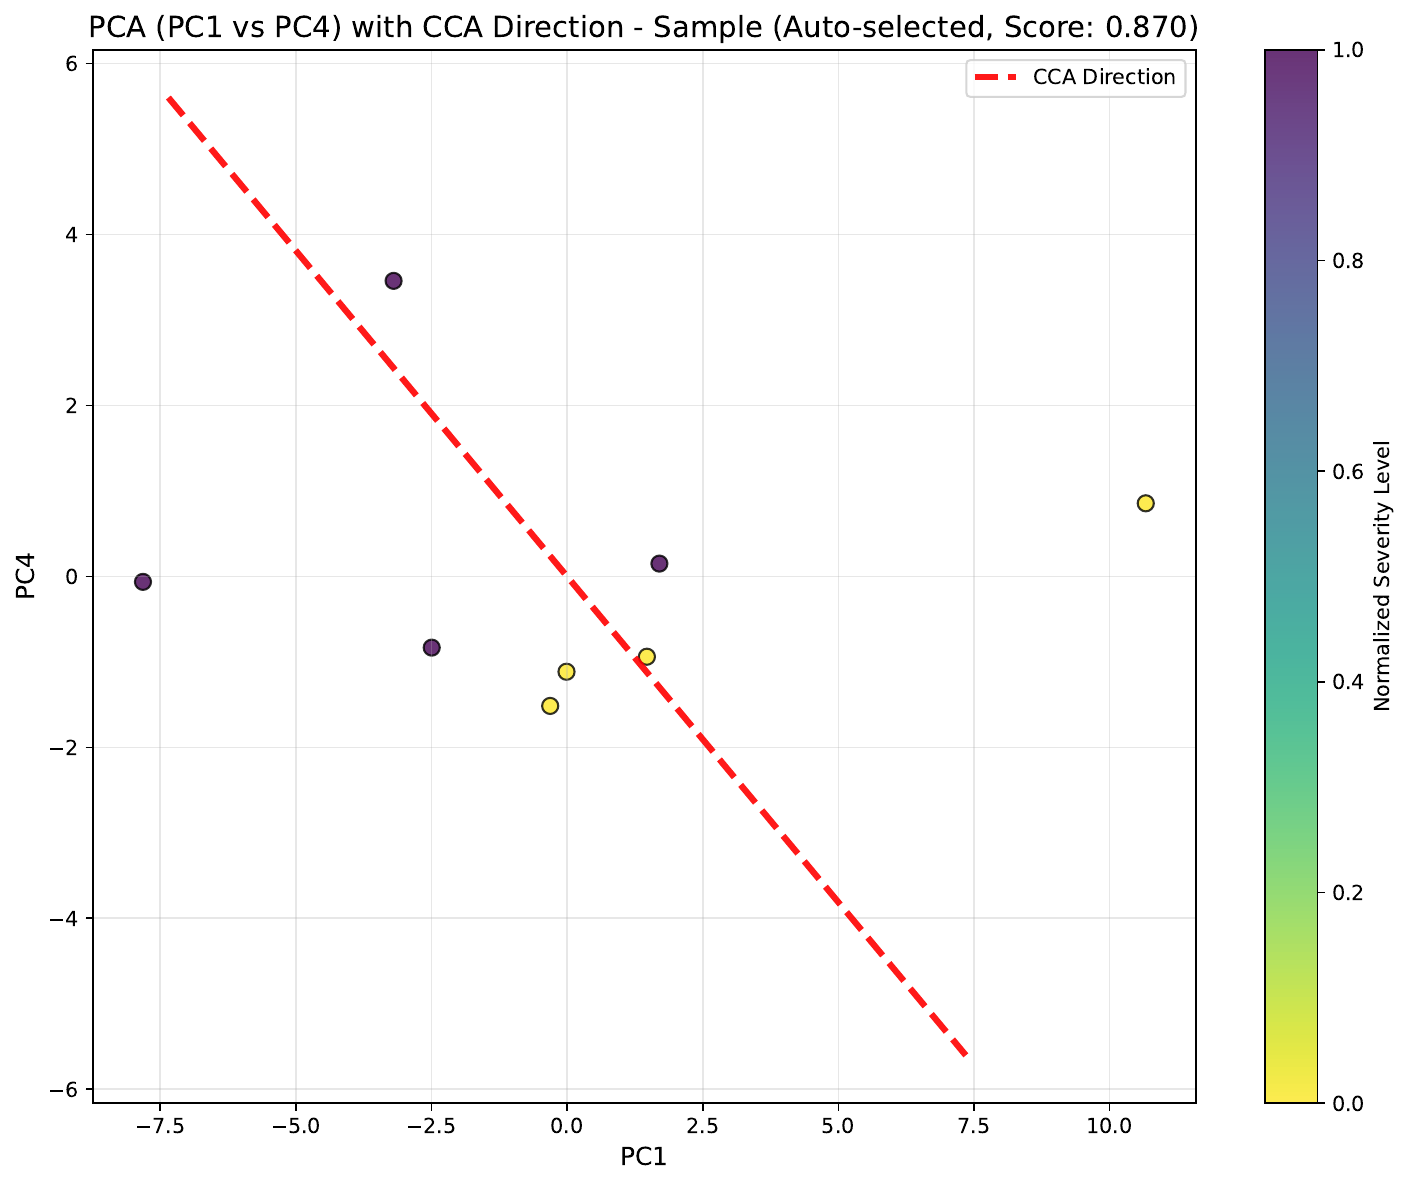
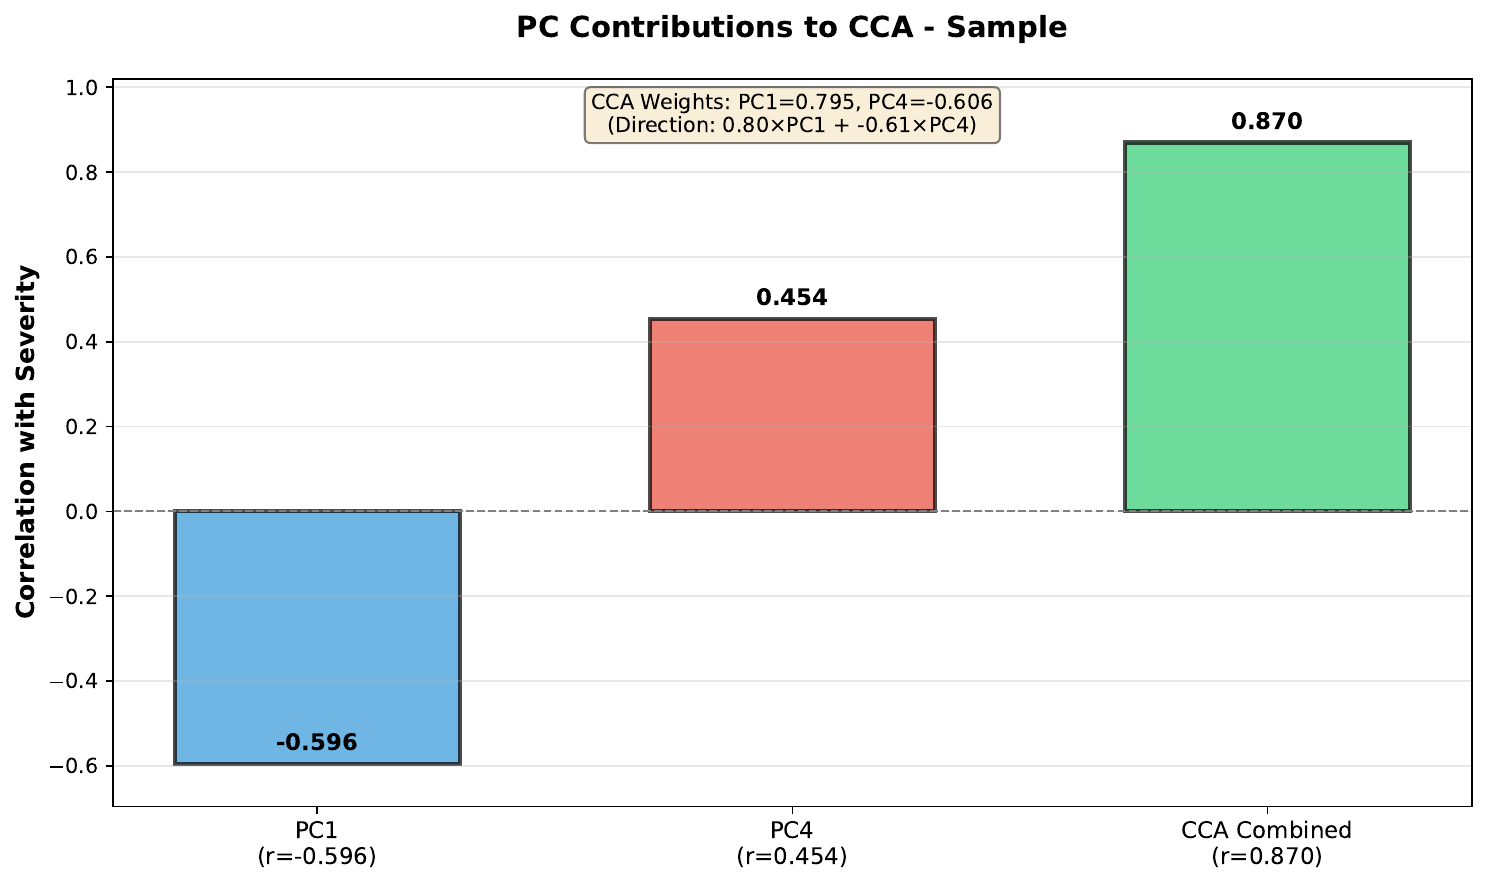
Samples projected onto the severity-maximizing axis of
X_DR_sample, with a breakdown of which PCs drive it.See the API pages for CCA_Call and cca_pvalue_test.